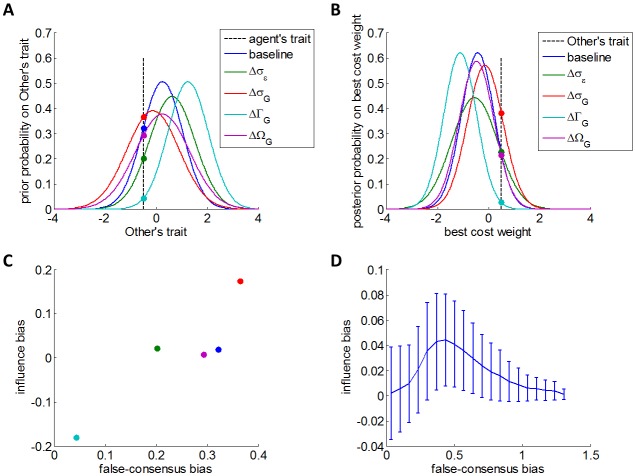
Fig 2. Qualitative predictions of the Bayesian model of attitude alignment.
We simulated a virtual population (endowed with arbitrary cost-susceptibilities), who learn about agents performing cost-benefit arbitrages (also endowed with arbitrary cost-susceptibilities). In panels A to C, the blue colour correspond to a baseline simulation, where all model parameters have been set to unity. Other colours correspond to simulations in which each model parameter has been increased by a unitary amount in turn (σε: green, σG: red, ΓG: cyan, and ΩG: magenta). The impact of model parameters can thus be eyeballed in terms of the induced changes w.r.t. the baseline simulation. A: false consensus bias FCB, as defined in Eq 10. The agent's prior probability about the Other's trait (y-axis) is plotted against possible Other's traits. The black dotted line depicts the agent's own trait, and the height at which it crosses the prior probability densities signals the false-consensus bias. B: influence bias IB, as defined in Eq 13. The agent's updated posterior belief about the "best" cost weight (y-axis) is plotted against possible "best" cost weights. The black dotted line depicts the Other's trait, and the height at which it crosses the updated posterior belief signals the influence-consensus bias (plus a correction term that derives from the agent's initial belief). C: influence bias IB (y-axis) is plotted as a function of false-consensus bias FCB (x-axis). This graph was constructed from the same simulations as in panels A and B. D: same as in panel C, but this time IB is averaged across 105 Monte-Carlo simulations that vary randomly all model parameters (namely: σε, σG, ΓG, ΩG, and α(o)). The ensuing biases have been binned according to FCB, and error bars depict the resulting Monte-Carlo mean and standard deviation.

