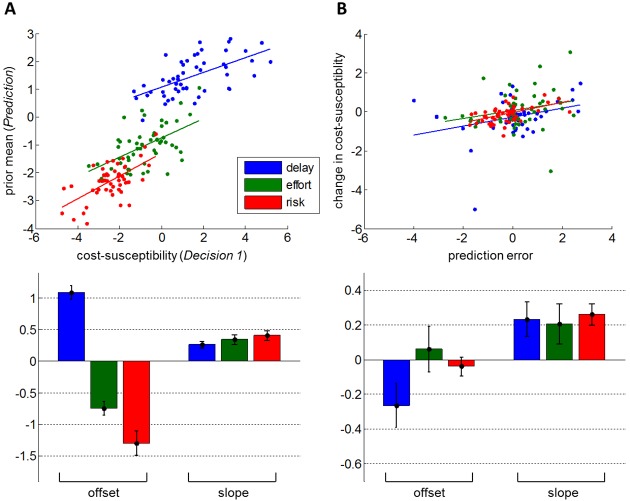
Fig 5. Validation of qualitative model predictions.
Assessment of false-consensus (A) and influence biases (B), in terms of estimated parameters of BPL and cost-benefit arbitrage models. A: Top: participants’ prior mean on the Other’s cost-susceptibility (y-axis) is plotted as a function of their own cost-susceptibility (x-axis), for the three different types of cost (blue: delay, green: effort, red: risk). Bottom: group-level estimates (+/- standard error on the mean) of offsets and slopes for each cost type. A: Top: participants’ change in cost -susceptibility (y-axis) is plotted as a function of prediction error (x-axis), for the three different types of cost. Bottom: group-level estimates (+/- standard error on the mean) of offsets and slopes for each cost type.

