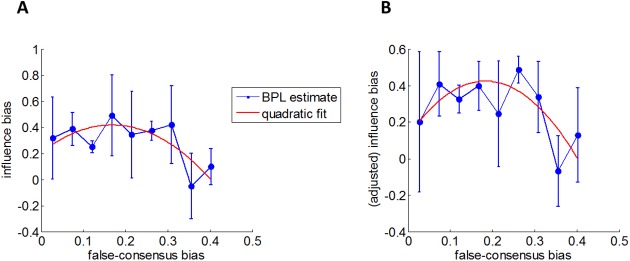
Fig 6. Assessment of the relationship between false-consensus and influence biases.
This figure summarizes the attempt to validate the prediction summarized on Fig 2D. A: participants' influence bias (y-axis) is plotted as a function of their false-consensus bias FCB (x-axis), in the Different condition, across all cost types. The data have been binned according to FCB, and blue error bars depict the resulting mean and standard errors around the mean. The red line depicts the best fitting quadratic expansion. B: Same as in A, but this time with influence biases corrected for age and gender inter-individual variability.

