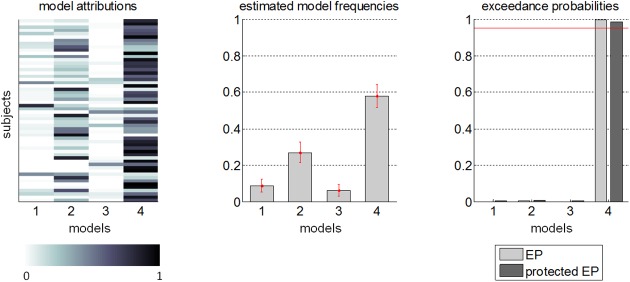
Fig 7. Model-based results.
Evaluation of the joint treatment of false-consensus and influence biases, in terms of a group-level statistical comparison of four candidate models of participants’ behaviour over all Decision and Prediction phases (m1: no false-consensus, no influence; m2: false-consensus, no influence; m3: no false-consensus, influence; m4: false-consensus and influence). Left: model attributions for each model (x-axis) and each participant (y-axis). Middle: estimated model frequencies (+/- posterior standard error) of each model. Right: exceedance probabilities (light grey) and protected exceedance probabilities (dark grey) of each model.

