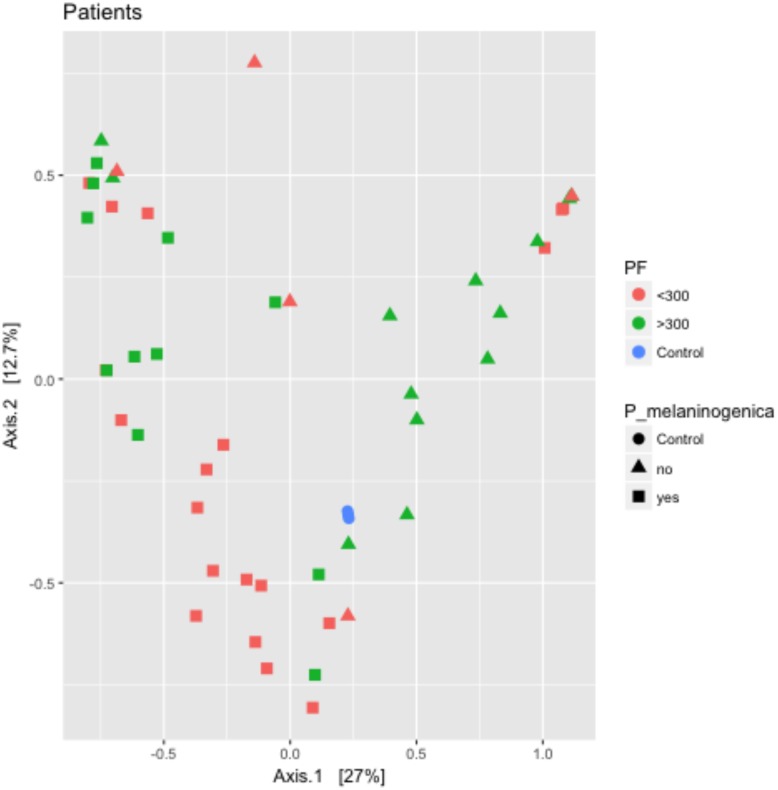
Fig 4. Clustering by principle components analysis suggests microbiota similarity in the presence of P. melaninogenica.
The R package phyloseq was used to generate a PCA plot of patient microbiota abundance. Patient samples containing P. melaninogenica cluster to the left side of the graph and are split based on PaO2/FiO2 ratio. Manhattan distance was used to perform the ordination prior to plotting the PCA graph. Data points are colored by patient PaO2/FiO2 ratio (Red: P/F < 300; Green: P/F > 300) and data point shape indicates presence (square) or absence (triangle) of P. melaninogenica. Control samples are included for comparison (blue circles). (n = 48).

