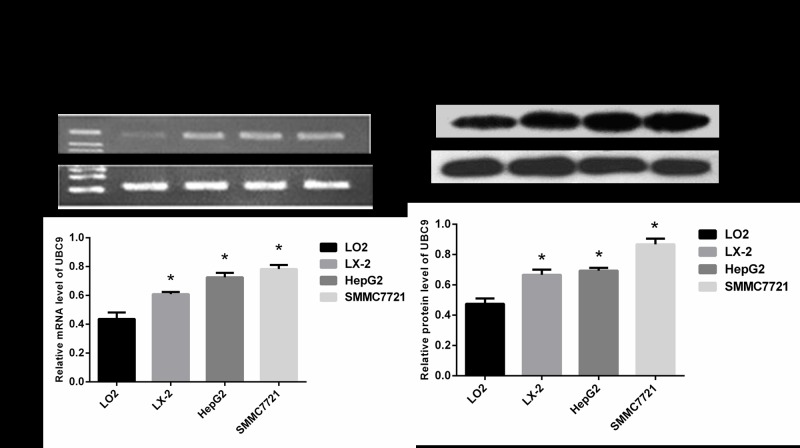
Fig 1. UBC9 expression levels in the normal liver cell line LO2, hepatic stellate cell line LX-2 and hepatoma cell lines HepG2 and SMMC-7721.
(A) Top: UBC9 mRNA was examined in LO2, LX-2, HepG2 and SMMC-7721 cells by RT-PCR. Bottom: Graph of relative ratios of UBC9 mRNA to β-actin in each cell line. (B) Top: UBC9 protein expression was examined in LO2, LX-2, HepG2 and SMMC-7721 cells by Western blot. Bottom: Graph of the relative ratio of UBC9 protein to β-actin in each cell line. *P < 0.05 compared with LO2, n = 4.

