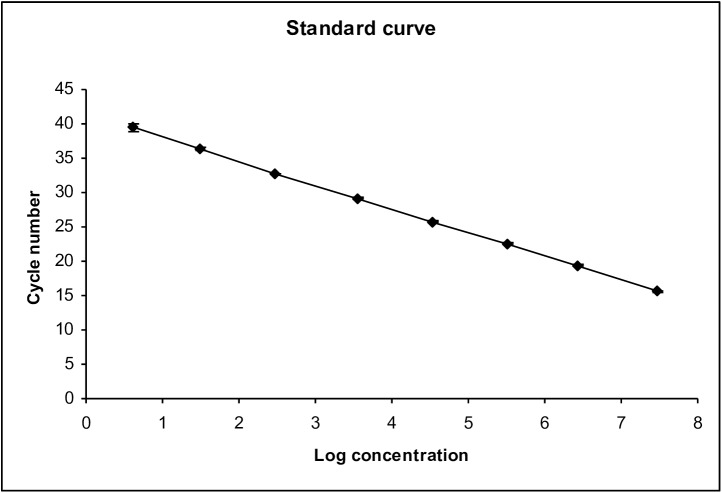
Fig 1. The standard curve shows linearity over a large dynamic detection range (from 3 to 30.000.000 copies) of the PCR assay.
Mean and errorbars of one standard deviation are shown All negative (water) and positive controls (the standard in dilution 10−8) performed as expected. Inhibition of the PCR reaction occurred with only one patient, suspected to have PCP. The RNase P assay showed only minor variations between samples and standardization was not necessary. Two samples from a blood donor and a renal transplant patient were RNase P negative and were excluded.

