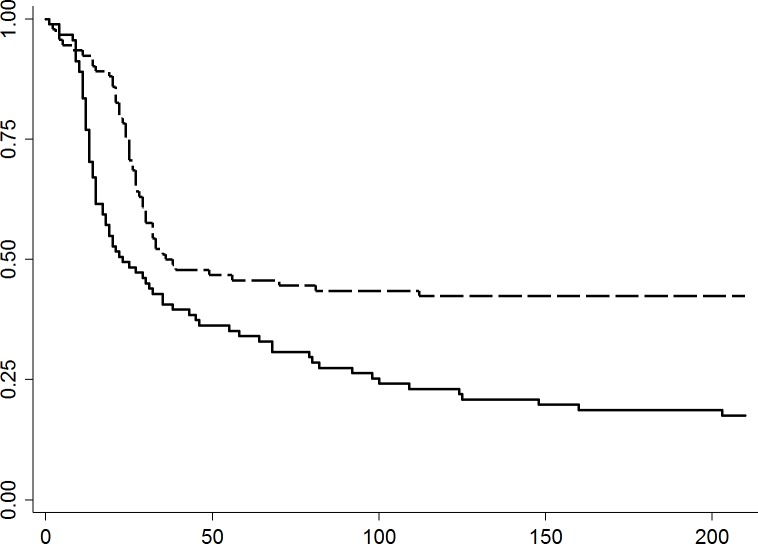
Fig 2. Kaplan-Meier survival curves of days to development of URI among cats in 2011 (n = 95; solid line) or 2012 (n = 94; dashed line) during their shelter stay.
Curves are significantly different (p = 0.001). X-axis; Days at shelter. Y-axis; Probability free of URI. Dashed line; year 2012. Solid line; year 2011.

