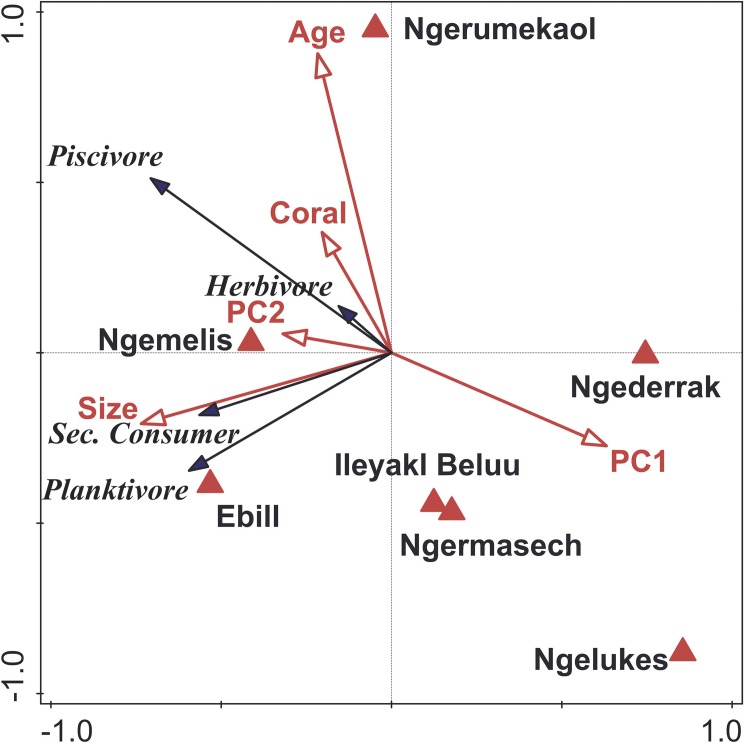
Fig 7. Biplot of results of redundancy analysis on fish biomass of trophic groups with MPA variables (MPA age, MPA size, distance from land, live coral cover, and benthic habitat [PC1, PC2]).
Data were centered, standardized, and log transformed fish biomass for trophic groups by MPA. MPA characteristics were centered and standardized prior to analysis.

