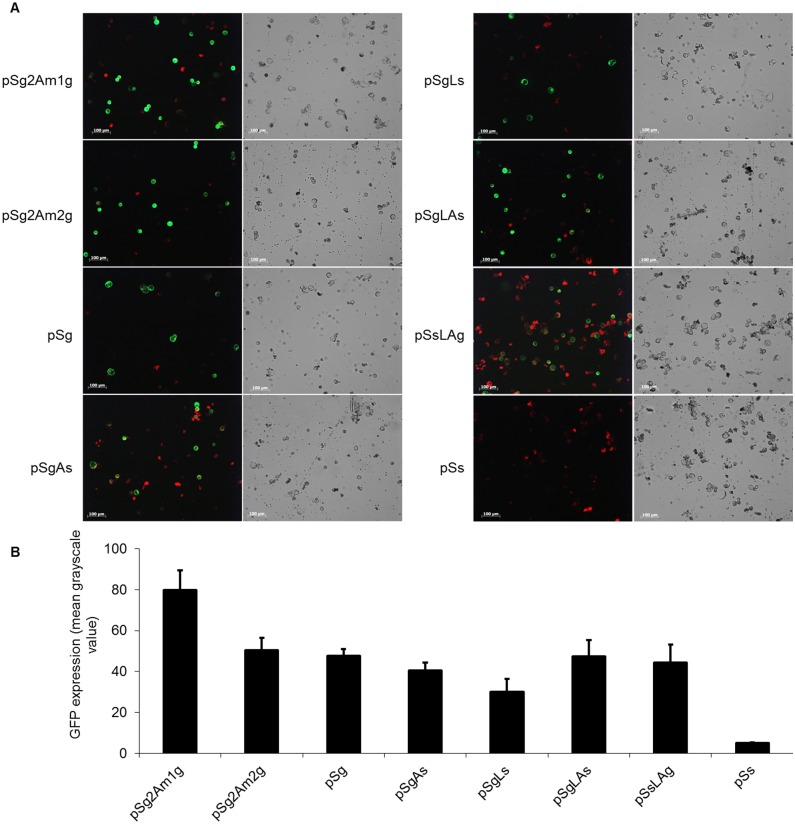
Fig 3. GFP analyses of different vector transformed protoplasts.
(A) Confocal microscopy of the transformed protoplasts. Green signals indicate cleaved GFP. The scale bar represents 100 μm. (B) Quantification of GFP expression. The amount GFP expression in each form of vector was estimated from its fluorescence intensity measured by Image J software.

