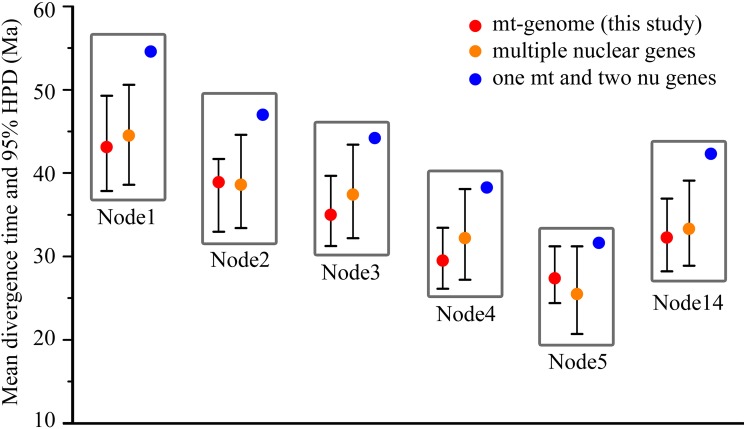
Fig 3. Comparison of divergence-time estimates among the seven Feliformia families across three studies.
The circle within boxes represents the mean of the posterior estimate, and the whiskers mark the upper and lower 95% highest posterior density of the age estimates. The comparison shows that our new time estimates are largely congruent with previous results based on multiple nuclear genes but considerably younger than those estimated by one mitochondrial Cytb gene and two nuclear genes. Nodes in this figure correspond to Table 1.

