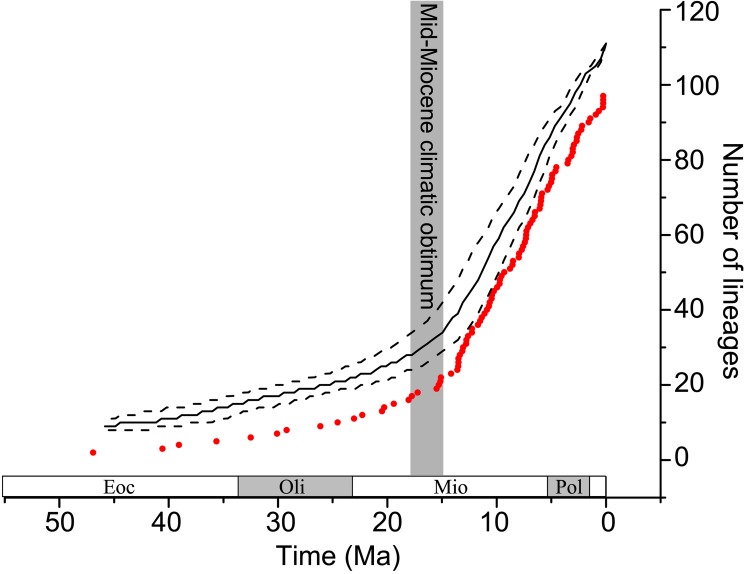
Fig 4. The LTT plot of Feliformia.
An expected lineages-through-time plot was analyzed based on the BEAST MCC tree with median (black solid line) and 95% CI (black dotted lines) numbers of lineages through time shown. The observed lineage-through-time plot (red filled circles) was statistically based on the time tree (Fig 2).

