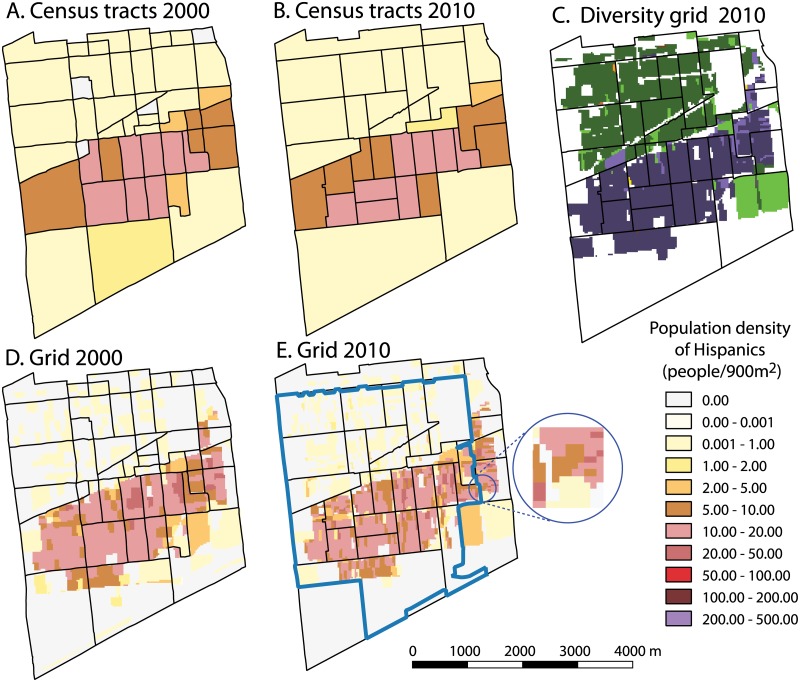
Fig 1. Maps showing distribution of the Hispanic population in central Chicago according to Census tracts (panel A for 2000 and panel B for 2010) and according to high resolution grids (panel D for 2000 and panel E for 2010).
Census tracts boundaries are overlaid on grid-based maps for reference. Extent of the ZIP Code is shown in blue. Inset in panel E is to show the high (30m) resolution of the grid. Racial diversity grid-based map (D) shows spatial extents of two communities, Blacks-dominated (green color) and Hispanic-dominated (violet color).

