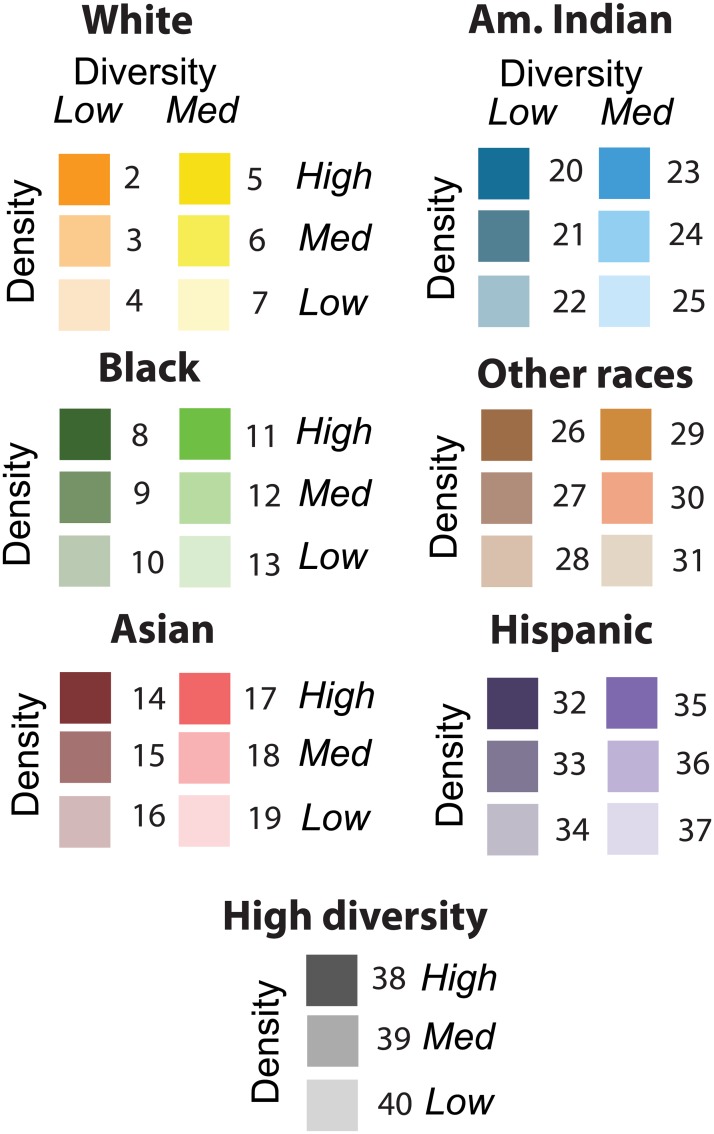
Fig 2. Classification of population into 39 different communities based on degree of diversity, dominant race, and population density.
Colors serve as a legend to the diversity maps (see Fig 3), numbers are numerical labels as encoded in diversity data downloadable from SocScape.)

