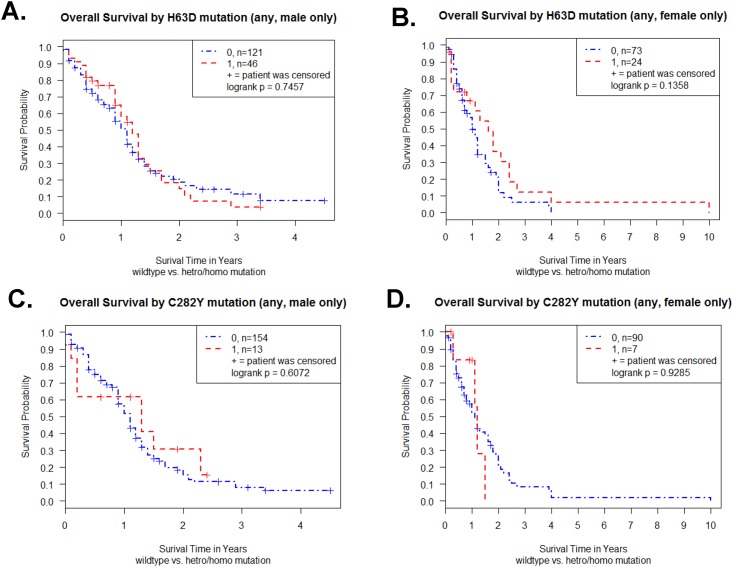
Fig 2. Effect of gender on Kaplan-Meier survival curve of TCGA GBM patients.
(A) Survival curve of male GBM patients (n = 167) with or without H63D HFE polymorphism. (B) Survival curve of female GBM patients (n = 97) with or without H63D HFE polymorphism. (C) Survival curve of male GBM patients (n = 167) with or without C282Y HFE polymorphism. (D) Survival curve of female GBM patients (n = 97) with or without C282Y HFE polymorphism. Plot symbols indicate censored points. Statistical analysis was performed by log-rank test and indicated as p value. Patients with either H63D or C282Y HFE polymorphism were represented in the figures by the red line and those without were represented by the blue line.

