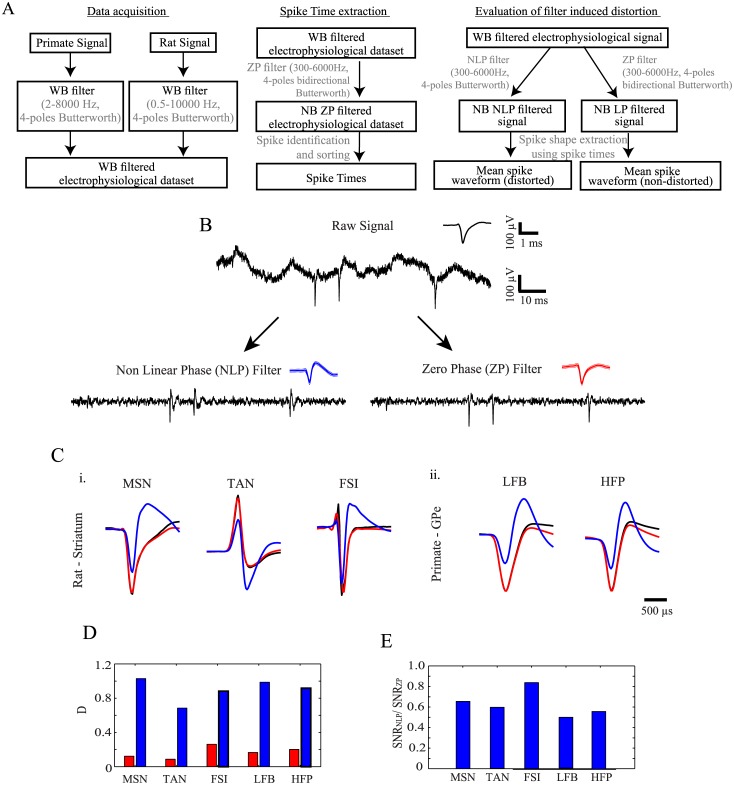
Fig 1. Filtration effect on spike shape in experimental data.
(A) A scheme presenting the electrophysiological data processing procedures used in this study. (B) Raw signal (top) recorded from a rat striatum and the band pass (300–6000 Hz) filtered signals (bottom). The mean action potential waveforms appear as insets (black—raw signal, blue—NLP filtered signal, red—ZP filtered signal. mean ±1 STD). (C) Mean waveforms of (i) a medium spiny neuron (MSN), a tonically active neuron (TAN) and a fast spiking interneuron (FSI) recorded from the rat striatum. (ii) High frequency pauser (HFP) and low frequency burster (LFB) recorded from the primate GPe (D) Distance between the raw and post filtration waveforms of the neurons presented in (B). (E) The ratio of the SNR of the NLP filtered signal to the SNR of the ZP filtered signal.

