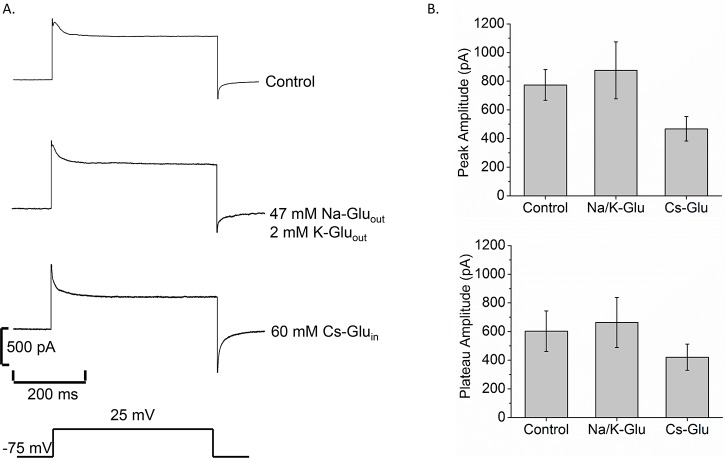
Fig 1. Bge cell membrane current is not carried by K+ or Cl-.
A. Current traces in response to a voltage step from -75 mV to 25 mV for 500 msec for control solutions (top), 47 mM Na-Gluout/2 mM K-Gluout, with gluconate replacing Cl- in the bathing solutions (second trace), and 60 mM Cs-Gluin replacing KCl in the internal solution (third trace). The bottom pulse represents the voltage applied to the cell. B. Bar graphs show the mean peak current (top), and mean plateau current (bottom) for each group. N = 15 (control); N = 7 (Na/K Glu); N = 5 (Cs-Glu).

