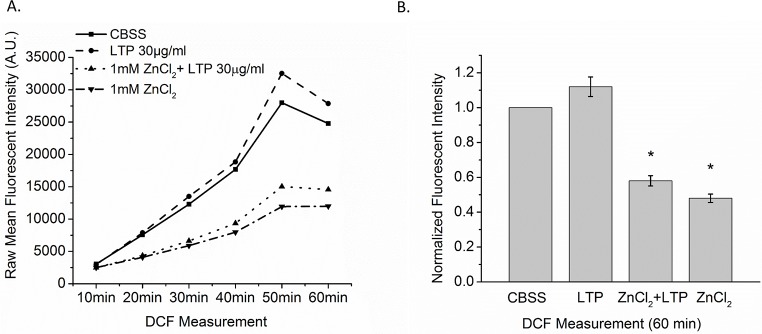
Fig 7. ROS production in Bge cells measured with DCFH-DA.
Bge cells were exposed for 1 hr to CBSS only, LTP only, 1 mM ZnCl2 only or LTP + 1 mM ZnCl2. A. Raw DCFH-DA fluorescence was measured at 10 min intervals for 60 min and mean values plotted. ZnCl2 (downward triangle with dashed-dotted line) and LTP + ZnCl2 (upward triangle with dotted line) reduced fluorescence compared to CBSS control (square with solid line). LTP (circle with dashed line) had a weak, insignificant stimulatory effect. B. Bars show mean fluorescence with treatment normalized to constitutive control (CBSS) at 60 min. Bars represent means ± SEM. N = 5.

