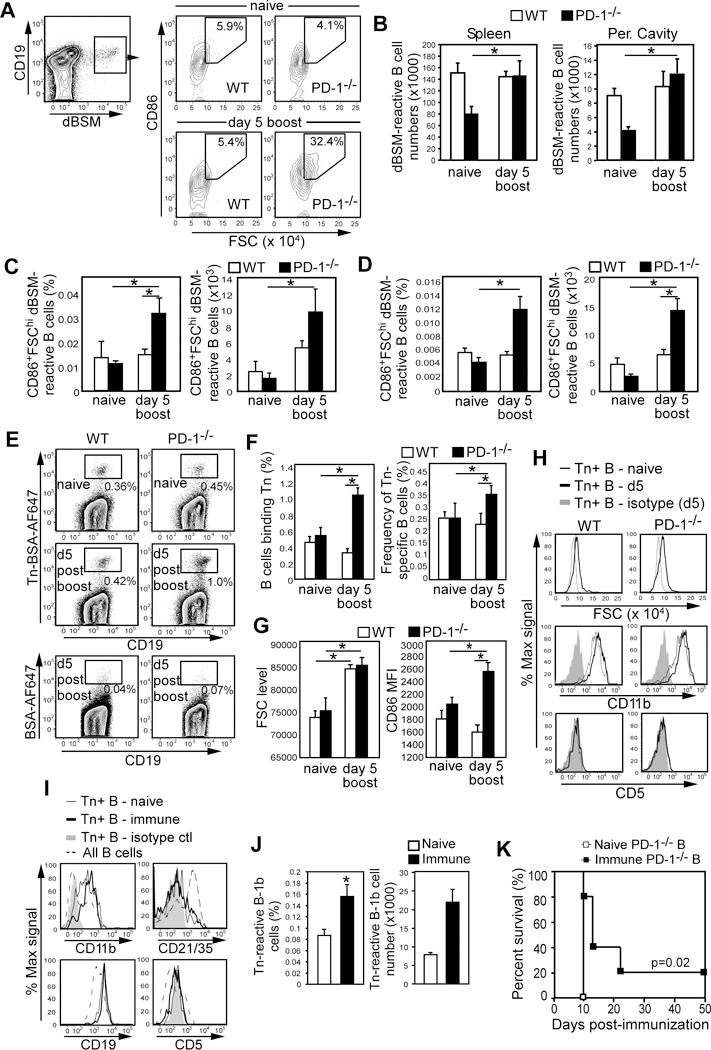
Figure 4. PD-1 suppresses activation and expansion of dBSM- and Tn-specific B-1b cells and B cells from immune PD-1−/− mice transfer antitumor protection.

A–D) Analysis of dBSM-specific B cells in peritoneal cavities and spleens. A) Representative gating for peritoneal dBSM+CD19+ B cells with subgating on CD86+FSChi cells for naïve and immune (d5 post dBSM boost) mice. B) Mean numbers (±SEM) of dBSM-binding B cells. C–D) Mean frequencies and numbers (±SEM) of CD86+FSChi dBSM-binding B cells in peritoneal cavities (C) and spleens (D). E–K) Analysis of Tn-specific peritoneal B cells. E) Representative gating of Tn-BSA-binding and BSA control-binding CD19+ peritoneal B cells. F) Mean frequencies of B cells binding Tn(left panel) and frequencies of Tn-specific B cells among peritoneal leukocytes (right panel). G) Mean (±SEM) FSC and CD86 MFI values for Tn-specific peritoneal B cells. H) Phenotype of Tn-specific peritoneal B cells. Shaded histograms represent isotype controls. For panels A–H, WT and PD-1−/− mice were immunized with dBSM on d0, 21, and 176. Ag-specific B cells were analyzed on d181 (d5 post boost). In A–G, asterisks(*) indicate significant differences in mean (± SEM) values (p <0.05; n=4–8 mice/group). I–J) PD-1−/− mice were immunized with dBSM on d0 and 21 and challenged with TA3-Ha cells on d42. On d125, Tn-specific peritoneal B cell phenotype (I) and numbers (J) were assessed (n=3–4 mice/group). K) Spleen B (3 × 10⁷ i.v.) and peritoneal B (8 × 10⁶ i.p.) cells from dBSM-immune PD-1−/− mice that survived TA3-Ha challenge were transferred into naïve WT mice. Two days later, mice were challenged with 2 × 10⁴ TA3-Ha cells (n= 5/group).
