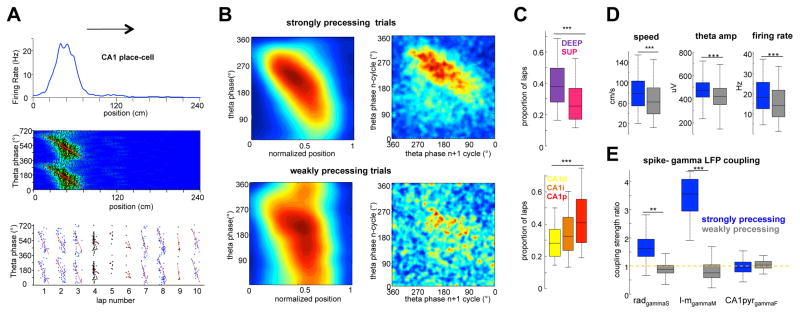
Figure 4. Place fields with and without phase-precession.
(A) Firing rate plot (upper panel) and theta phase-position spike density map (middle) for an example place cell. Red line represents linear-circular regression. Bottom: Trials with strong (P < 0.05 and r2 > 0.1; blue dots) and weak (p > 0.05; black) spike phase-position correlation. (B) Left: Average normalized phase-position correlation density plots for all CA1 place cells (n = 487 cells, 6 rats) constructed separately for trials with strong and weak phase-position correlation. Right: Correlation of spike phase in n versus n + 1 theta waves. (C) Proportion of significantly phase-precessing trials for deep and superficial place cells (top), and for neurons in CA1 subregions (bottom). (D) Running speed, theta amplitude and in-field firing rate during strongly (blue) and weakly (grey) precessing trials. (E) Spike–LFP coupling of place cell spikes for strongly and weakly precessing trials (normalized to the entire session), shown separately for gamma sub-bands. (**/*** p < 0.01/0.001, rank-sum test or one-way Kruskall-Wallis for intra CA1 comparison). See also Figure S5.

