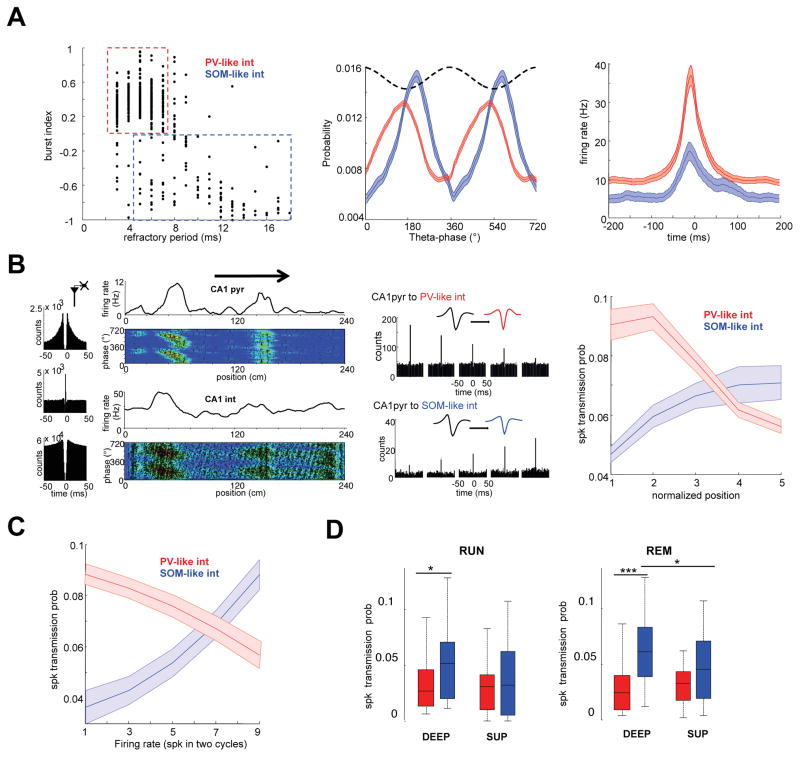
Figure 6. Switching somato-dentric inhibition and gamma inputs.
(A) CA1 putative interneurons were divided into PV-like and SOM-like subgroups, according to their proportion of burst spiking and refractory period (Royer et al., 2012: see Methods). Middle: Distribution of theta phase discharge probability for both groups. Right: Peri-ripple firing histogram for both groups. (B) Left panel: Autocorrelogram of pyramidal cell (top), PV-like interneuron (bottom) and their cross-correlogram (middle), indicating that they are monosynaptically connected. Second panel: spike versus theta phase plots of the neuron pair on the track. Note spike phase-precession of both neurons. Third panel: Example cross-correlograms for two representative pyramidal cell-interneuron pairs in the five bins of the place field. Right panel: Spike-transmission probability between CA1 place cells and the two classes of interneurons, shown in five bins of the place field (n = 256 place cell-PV-like pairs; n = 35 place cell-SOM-like pairs). Spike transmission probability between pyramidal cells and PV-like interneurons was high at the entrance of the field and decreased afterward. In contrast, the spike transmission between pyramidal cells and SOM-like interneurons gradually increased as the rat crossed the field. (C) Spike transmission probability as a function of pyramidal cell firing rate in 10 firing rate bins during RUN and REM epochs. Spike transmission probability between pyramidal cells and PV-like interneurons is high at low firing rates and rapidly decreases with rate increase of the driving pyramidal cell, whereas spike transmission to SOM-like interneurons increases with firing rate. Shaded areas mean ± SEM. (D) Spike-transmission probability during RUN and REM shown separately for CA1 deep layer pyramidal cell-interneuron and superficial layer pyramidal cell-interneuron pairs. See also Figure S8.

