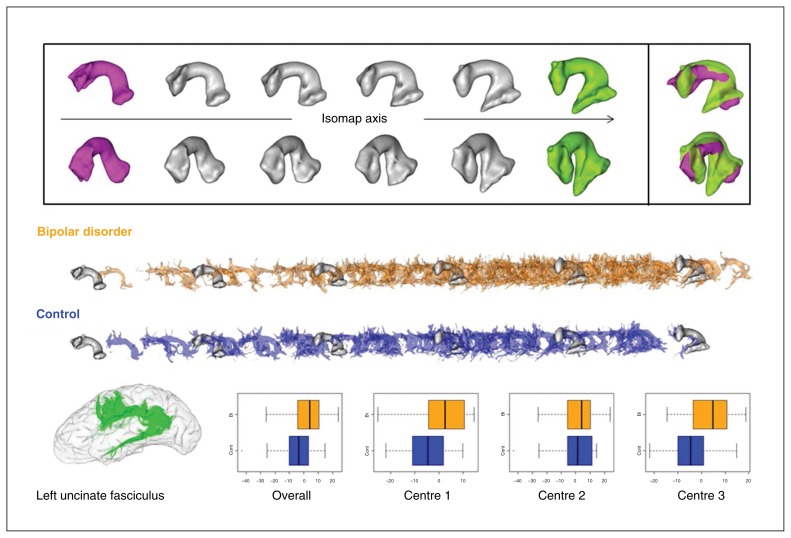
Fig. 5.
Second dimension of the arcuate fasciculus Isomap. (Top) Moving average shapes (MAS) along the Isomap axis observed with 2 different orientations (for each orientation, the frontal horn of the bundle is on the left). The extreme MAS (green and magenta) are combined to highlight the shape feature encoded by the Isomap. This dimension captures a pure shape feature: the extent of the development of the bundle toward the temporal pole. (Middle) Distributions along the Isomap axis of the left bundles of patients with bipolar disorder versus controls superimposed over the same MAS. (Bottom) Arcuate fasciculus sample and overall and centre-based boxplots of the localization in the Isomap after adjustment for fractional anisotropy, age and sex.

