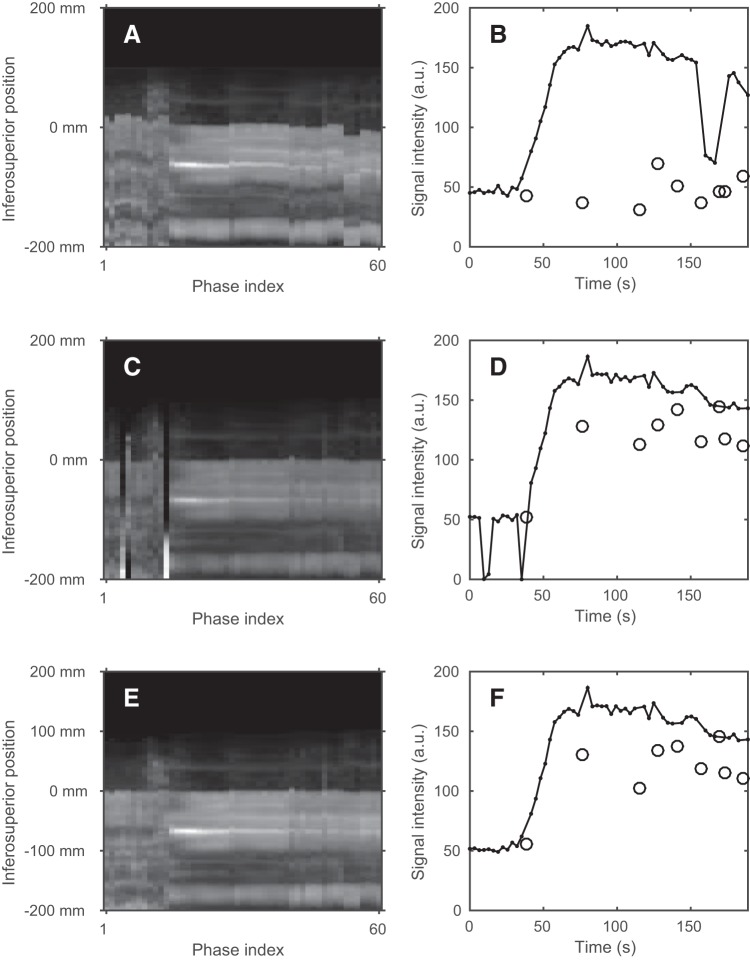
Figure 4.
The intensity along a 40-cm-long column extending in the inferosuperior direction is seen for the phases before registration (A), after conventional registration (C), and after robust registration (E). The mean intensity of a 1-cm3 cubic ROI placed 1 cm below the liver dome is seen as a solid black curve for the phases before registration (B), after conventional registration (D), and after robust registration (F). The black circles indicate the intensities of phases excluded because of deep inhalations during examination. For each column of (A), (C), and (E), the intensity profile was divided by its mean to improve the visual contrast of the figure.

