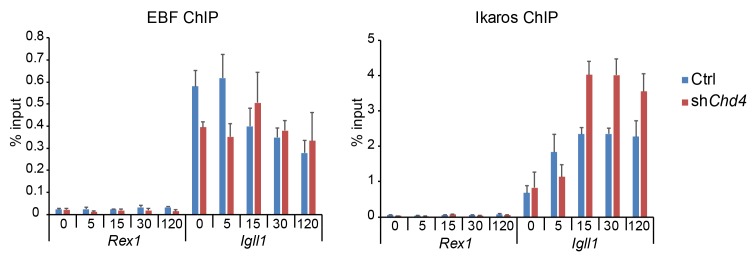
Author response image 6. EBF1 and Ikaros ChIP at Igll1 compared to the control locus Rex1.
The data shown are for B cells transduced with Ikaros-IRES-Cherry and represent the mean ± SE of 3 independent biological replicates. The data have been added to the source data file for Figure 7B of the revised manuscript.

