
Fig. 3. Transitory changes of mitochondrial encoded transcripts in ipsilesional striatum.
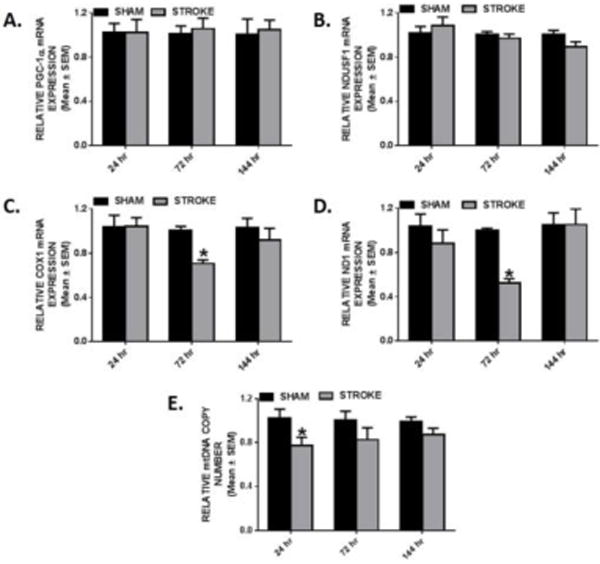
Rats were subjected to either sham or ET-1 treatment. PGC-1α (a), NDUFS1 (b), COX1(c) and ND1 (d) mRNA expression was determined by qRT-PCR using tubulin as a control gene. mtDNA copy number (e) was determined by qRT-PCR, using ND1 for the mtDNA gene and β-actin for the nuclear control gene. These markers were measured in the ipsilesional striatum 24, 72, and 144hr. Values reported as mean ± SEM. n ≥ 10, *p < 0.05