
Figure 1.
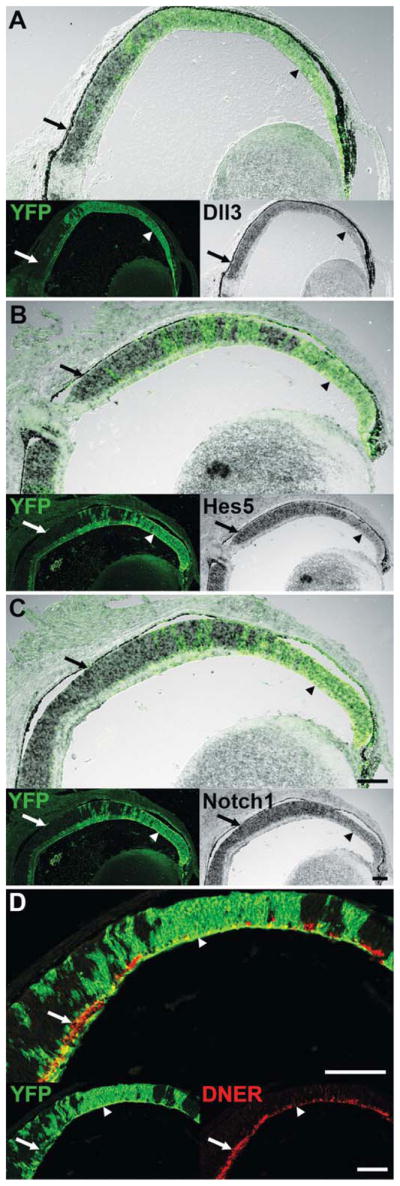
Characterization of Notch signaling components at P0. A–D, YFP staining (green) indicates areas of Dicer CKO. A–C, In situ hybridization for Dll3, Hes5, and Notch1 shows reduced transcript levels in Dicer CKO areas (green, arrowheads) compared to wild type areas (arrows). D, Immunofluorescence staining for DNER (red) shows reduced expression in Dicer CKO areas (green, arrowhead) compared to wild type areas (arrow). Scale bars: 100 μm. [Color figure can be viewed in the online issue, which is available at wileyonlinelibrary.com.]