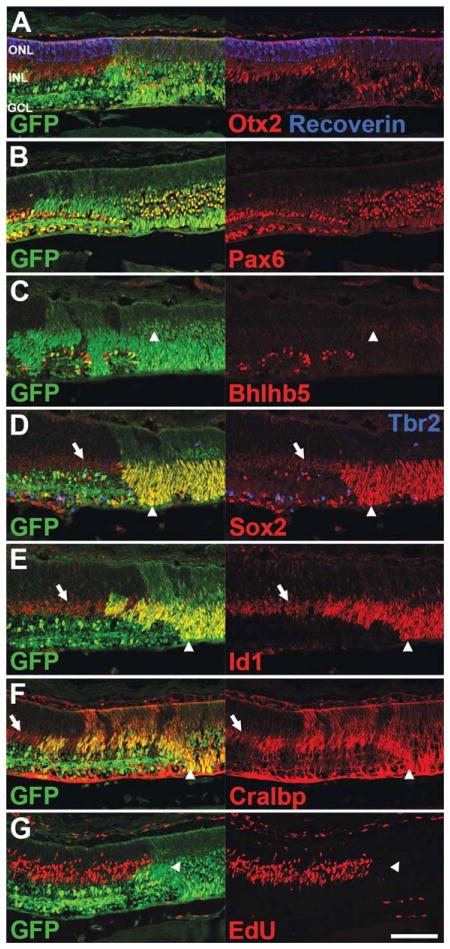
Figure 5.
Immunofluorescence staining of P5 NICD+ retinas. A–G, Nuclear GFP staining (green) indicates areas of NICD expression (NICD+). Note that scattered GFP+ cells are present in wild type areas of retina due to αPax6 expression in a subset of amacrine cells. A, NICD+ areas show a distinct outer nuclear layer (ONL), but disorganized inner nuclear layer (INL), and lack a ganglion cell layer (GCL). Faint Otx2+ photoreceptors and bright Otx2+ bipolar cells (red) are present in NICD+ areas of retina, but the mature photoreceptor marker recoverin (blue) is severely reduced. B, Bright Pax6+ amacrine cells (red) are present in NICD+ areas of retina, but show disrupted lamination. C, Bright Bhlhb5+ mature amacrine cells (red) are absent from NICD+ areas of retina, but some cells express low levels of Bhlhb5 (arrowheads). D, NICD+ Müller glia (arrowheads) express elevated levels of Sox2 (red), compared to wild type Müller glia (arrows), and show an expanded domain of expression. Tbr2+ mature ganglion cells and amacrine precursors (blue) are absent from NICD+ areas. E, NICD+ Müller glia (arrowheads) express elevated levels of Id1 (red), compared to wild type Müller glia (arrows). F, NICD+ Müller glia (arrowheads) express elevated levels of Cralbp (red), compared to wild type Müller glia (arrows). G, EdU was injected at P3. Centrally-located NICD+ glia lack EdU (red, arrowhead), indicating they were postmitotic at P3. Scale bar: 100 μm. [Color figure can be viewed in the online issue, which is available at wileyonlinelibrary.com.]

