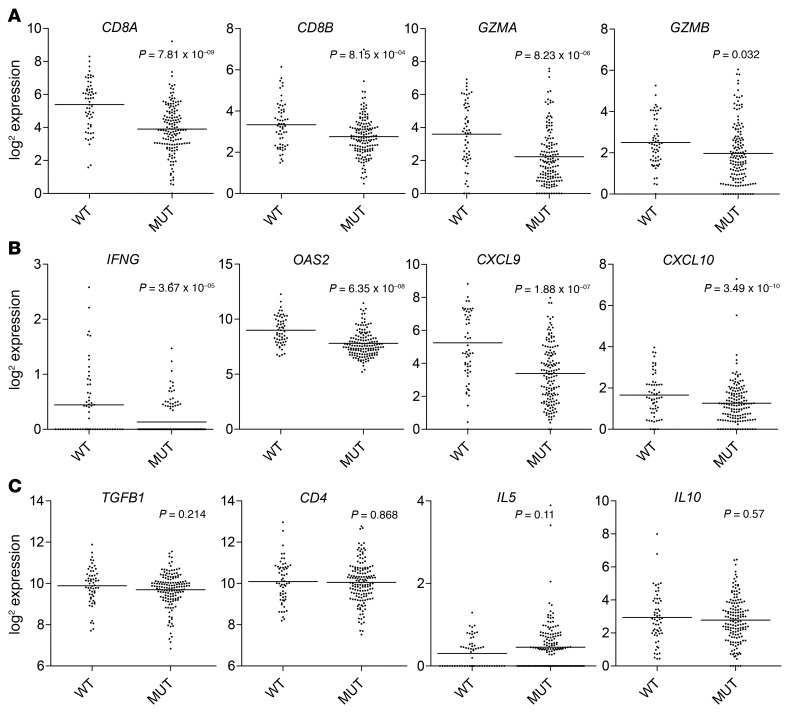
Figure 2. Lower expression levels of CD8+ T cell–associated genes in IDH-MUT versus IDH-WT patients.
TCGA level 3 gene expression data were downloaded from the University of California Santa Cruz Cancer Genome Browser for 1p/19q intact, WHO grade II or III glioma cases (n = 207) (http://www.cbioportal.org/). IDH-MUT (n = 149) and IDH-WT (n = 58) cases were compared for immune cell and immune effector gene expression levels. Differentially expressed genes associated with (A) CD8+ CTLs and (B) IFNG and IFN-γ–inducible genes. (C) Gene expression associated with immunosuppression (TGFB1), CD4 T cells (CD4), and type 2 immunity (IL5 and IL10). Graphs depict the log2 expression value of each gene: each dot represents 1 patient; black bars show the average value. P values were determined using 2-sided, unpaired t tests, with Benjamini-Hochberg adjustment for multiple testing.

