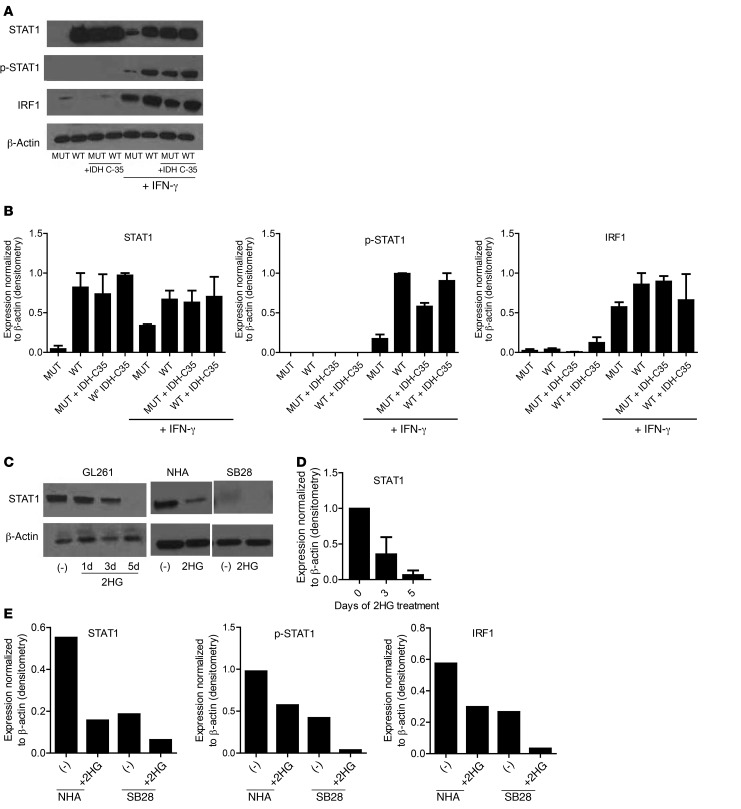
Figure 5. Decreased STAT1 protein levels in IDH-MUT and 2HG-treated tumor cell lines.
(A) Western blotting was performed on GL261-WT and GL261-MUT cell lysates in the presence or absence of 1 μM IDH-C35 and 100 ng/ml recombinant murine IFN-γ. (B) Quantification of Western blot bands by ImageJ. Data represent the mean ± SD of band density/β-actin of 2 to 4 experiments. (C) Western blotting was performed on cell lines treated with 3 mM 2HG. Data shown represent GL261 cells treated with 2HG for 1, 3, or 5 days and NHA and SB28 cells treated with 2HG for 5 days. (D) ImageJ quantification of Western blot bands from C. Data represent the mean ± SD of band density/β-actin band density from 3 independent experiments. (E) ImageJ quantification of Western blot band densities of STAT1, p-STAT1, and IRF1, normalized to β-actin levels for NHA and SB28 cells treated with 2HG. Data are representative of 2 independent experiments with similar results.

