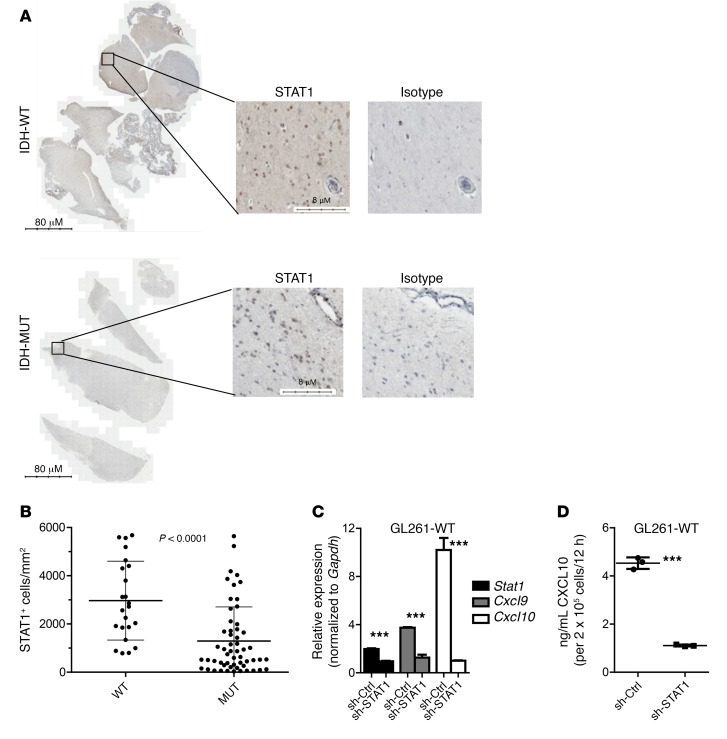
Figure 6. Decreased STAT1 positive cells in IDH-MUT compared with IDH-WT LGG tumor sections.
(A) Representative images showing STAT1 staining on IDH-WT and IDH-MUT WHO grade III LGG samples. Scale bars: 80 μm and 8 μm. (B) Quantification of STAT1+ cells per area of tumor (mm2) on IDH-WT (56 sections from 9 cases) and IDH-MUT (23 sections from 11 cases) tumors. Data represent the mean ± SD. Data obtained by 2-tailed unpaired t test. (C) RT-PCR analysis of Stat1, Cxcl9, and Cxcl10 expression in GL261WT cells stimulated with 10 ng/ml recombinant murine IFN-γ for 12 hours, 36 hours after transfection with 1 μg plasmid encoding either scrambled shRNA (OriGene Technologies; TR30013) or 4 shRNAs targeting STAT1 (OriGene Technologies; TG502153). (D) CXCL10 ELISA was performed using supernatant from the cells described in C. Data shown in C and D represent the mean ± SD of 3 biologic replicate samples and are representative of 2 independent experiments; ***P < 0.0001. sh-Ctrl, sh-control.

