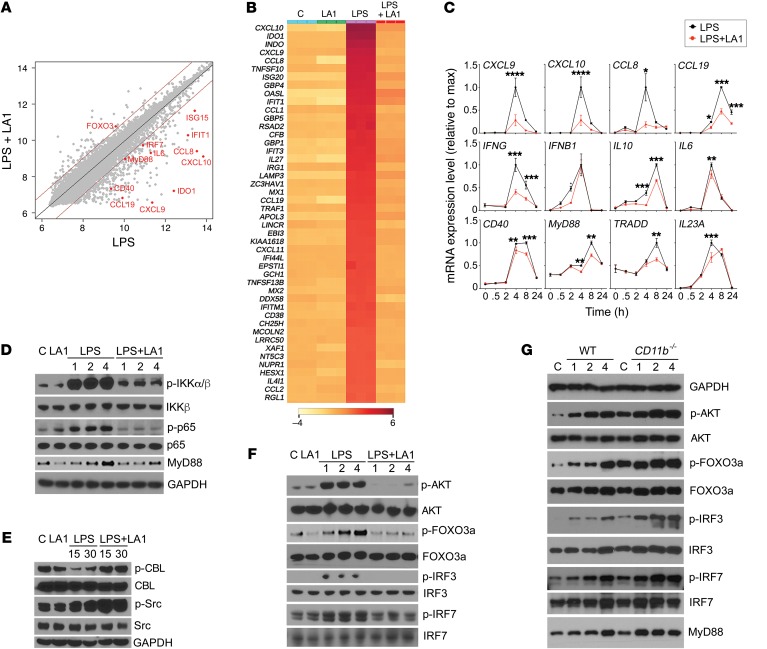
Figure 3. LA1-mediated CD11b activation suppresses IFN signaling via AKT/FOXO3/IRF3/7 axis.
(A) Scatter plot comparing global mRNA expression profiles from human macrophages treated with LPS (50 ng/ml) (x axis) or LPS (50 ng/ml) plus LA1 (20 μM) (y axis) for 4 hours. The dark red lines indicate a 2-fold cutoff for the ratio of expression levels. Data represent the average of 3 experiments and are on the log2 scale. The numbers of genes that are significantly changed by LA1 are labeled on the graph (red dots). (B) Hierarchical clustering of the gene expression data for the top 50 genes downregulated by LA1. (C) mRNA levels of CXCL9, CXCL10, CCL8, CCL19, IFNG, IFNB1, IL10, IL6, CD40, MYD88, TRADD, and IL23a in LPS-stimulated macrophages in the absence or presence of LA1 at various time points. Data are mean ± SEM from a triplicate experiment (*P < 0.05, **P < 0.01, ***P < 0.001, ****P < 0.0001, Student’s t test). (D–F) Immunoblot analysis of various phosphorylated (p-) and total proteins in lysates of RAW macrophages stimulated with LPS (50 ng/ml) for 0–4 hours (D and F) or 0–30 minutes (E) in the absence or presence of LA1. GAPDH (in D for D and F, in E for E) was used as loading control. (G) Immunoblot analysis of various phosphorylated (p-) and total proteins in lysates of primary mouse macrophages from WT and CD11b–/– animals. Macrophages in culture were stimulated with LPS (100 ng/ml) for 0–4 hours, lysed, and analyzed. GAPDH was used as loading control.

