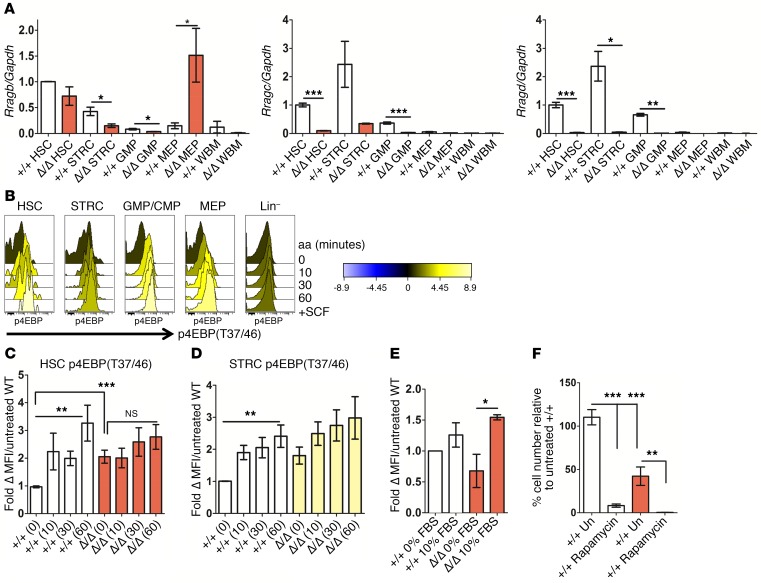
Figure 3. HSPC upregulate mTORC1 activity in the absence of Rraga, allowing cell production under stress conditions.
(A) qPCR analysis of Rragb, Rragc, and Rragd levels in the indicated populations from indicated genotypes (n = 2–4). Level of each molecule normalized to Gapdh is shown in relation to the level in WT HSC. (B) Quantitative histograms from WT BM treated with aa for the indicated time points (minutes) showing levels of p4EBPT37/46. Stimulation with the cytokine SCF is also shown for comparison. Color key shows fold change to untreated cells. (C and D) Lineage-depleted (LinDep) BM from mice of the indicated Rraga genotypes were placed in aa-free media containing 10% dialyzed FBS (aa depleted) for 1 hour and then stimulated with aa for the indicated time points in minutes. Intracellular flow cytometry was performed to assess levels of p4EBPT37/46 in the indicated gated populations after aa stimulation for the indicated time points in minutes. The fold change in levels of p4EBPT37/46 relative to WT unstimulated cells is indicated for LinDep HSC and STRC (n = 5–7). Student’s t test was applied comparing time 0 values between cells of WT and homozygous knockout genotypes. Ordinary 1-way ANOVA was applied to assess differences in mean fluorescence intensity (MFI) within WT or homozygous knockout groups. (E) LinDep BM from mice of the indicated Rraga genotypes was placed in aa-free media containing 0% or 10% dialyzed FBS (aa depleted). Shown are p4EBPT37/46 levels in the HSC gate (n = 3). (F) LSKCD48–CD150+ cells from mice of the indicated genotypes were cultured in media containing 10% FBS, IL-3, SCF, and TPO–containing media for 7 to 9 days with or without 10 nM rapamycin, and cell number was assessed by CountBright Absolute Counting Beads and normalized to WT untreated (n = 2 independent experiments and 4 total measurements per genotype and treatment). Un, unstimulated. One-way ANOVA with Tukey’s multiple comparison test was applied, and relevant statistically significant differences are noted. Error bars indicate SEM. *P ≤ 0.05; **P ≤ 0.01; ***P ≤ 0.001.

