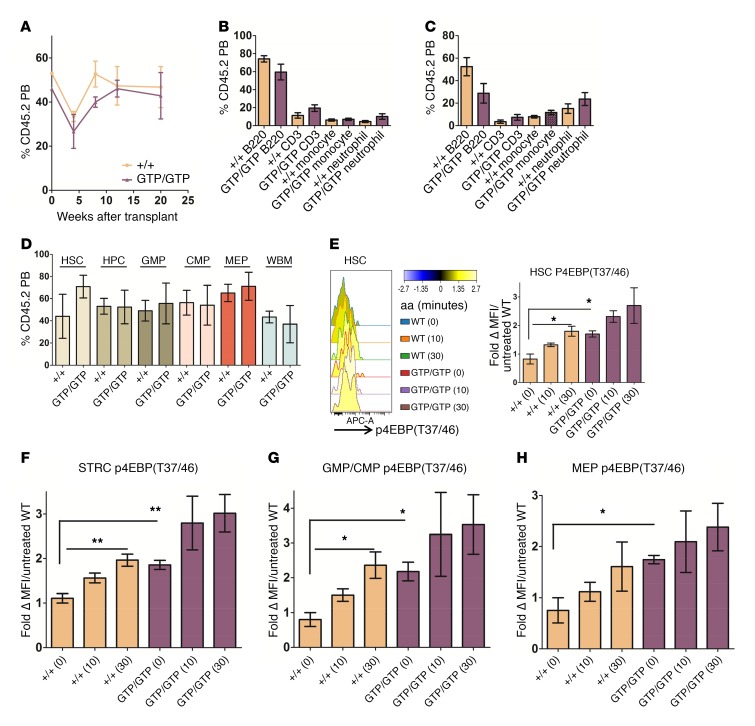
Figure 4. Constitutive nutrient signaling to mTORC1 preserves HSC function.
(A) Contribution of CD45.2 cells to total PB enucleated cells from donors of the indicated genotype over time (n = 4–5). (B) The percentage of CD45.2 cells that are B cells (B220), T cells (CD3), and myeloid cells (monocytes [Mac1+Gr1lo] and granulocytes [Mac1+Gr1+]) in the PB approximately 20 weeks after transplantation is indicated (n = 4–5). (C) Analysis as in B for BM lineage approximately 28 weeks after transplantation (n = 3). (D) The percentage of chimerism in each cell type of the indicated genotypes is shown at approximately 28 weeks after transplantation. HSC, Lin–Sca1+cKit+CD150+CD48–; HPC, non-HSC in the LSK fraction; GMP, Lin–Sca1–cKit+CD34+CD16/32+; CMP, Lin–Sca1–cKit+CD34+CD16/32–; MEP, Lin–Sca1–cKit+CD34–CD16/32– (n = 4). (E–H) Representative histograms from signal transduction experiments performed with cells from transplanted mice of the indicated genotypes. Cells were starved of aa (aa deprivation) and then stimulated for the indicated time points in minutes. Fold change above unstimulated WT cells is indicated. Lineage depleted (LinDep) BM from mice transplanted with cells from the indicated genotypes approximately 28 weeks after transplantation was stimulated with aa for the indicated time points (in minutes), then processed for flow cytometry. The fold change in levels of p4EBPT37/46 relative to unstimulated WT cells is indicated for (E) LinDepCD45.2+ HSC, (F) STRC, (G) GMP/CMP, and (H) MEP gated events (n = 3 mice each of the indicated genotype). Student’s t test was applied comparing time 0 values between cells of WT and GTP/GTP genotypes. Ordinary 1-way ANOVA was applied to assess differences in MFI within WT or homozygous knockout groups. Error bars indicate SEM. *P ≤ 0.05; **P ≤ 0.01.

