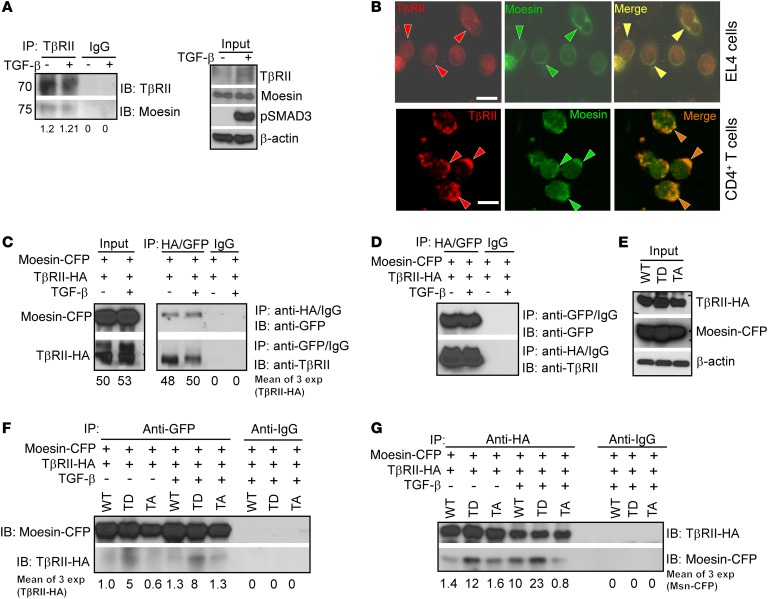
Figure 7. Moesin associates with TβRII.
(A) Immunoprecipitation (IP), with anti-TβRII and control antibodies of EL4 cell lysates, followed by immunoblotting. Mean band intensity of moesin is below. (B) Confocal microscopy images of EL4 cells and CD4+ T cells stimulated with TGF-β and stained with anti-TβRII and anti-moesin antibodies. Scale bars: 3 μm. Arrowheads indicate TβRII (red), moesin (green), or both (yellow). (C and D) HEK293FT cells cotransfected with plasmids encoding WT moesin tagged with CFP at the carboxy terminus (moesin-CFP) and TβRII tagged with HA at the carboxy terminus (TβRII-HA) and IP with anti-GFP and anti-HA antibodies. Input: whole cell lysate immunoblotting (throughout). (E–G) IP and immunoblot (as in C) of HEK293FT cells cotransfected with CFP-tagged WT or phosphomimetic moesin mutants and TβRII-HA constructs. Data are representative of at least 3 (A–C) or 4 (D–G) independent experiments. Mean band intensity of TβRII-HA (C and F) and Msn-CFP (G) based on ratio of CFP and HA.

