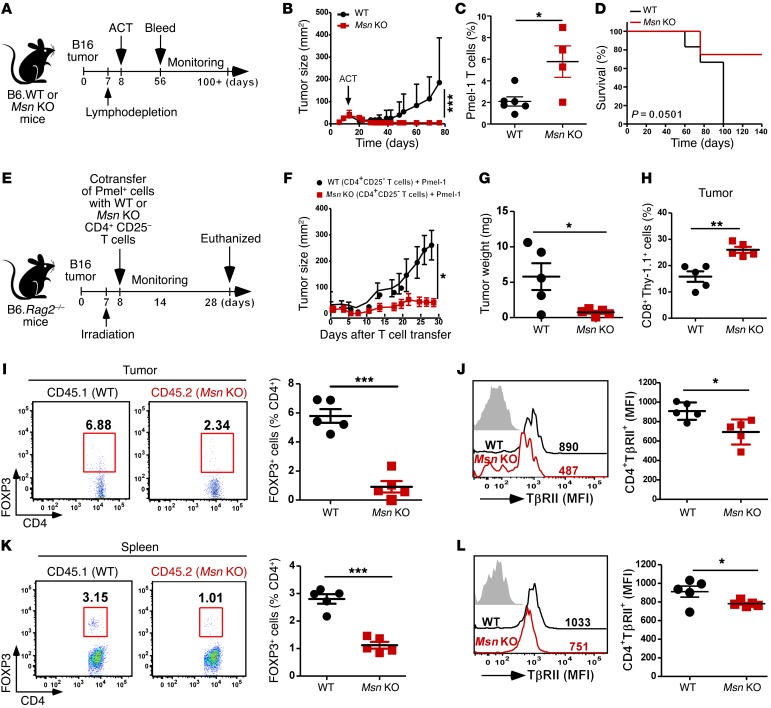
Figure 9. Moesin loss potentiates adoptive T cell therapy of melanoma.
(A) Treatment scheme for B6 mice injected s.c. with B16-F1 melanoma tumor cells (2.5 × 10⁵) 7 days before lymphodepletion with 6 Gy total-body irradiation and adoptive cell transfer (ACT) of 2 × 10⁶ Pmel-1 T cells (i.v.) at day 8. (B) Tumor growth kinetics in individual mice treated as indicated in A; WT, n = 6; Msn KO, n = 4. (C) Frequency of donor Pmel-1 CD8+ T cells in the blood of WT and Msn KO mice from B at 8 weeks. (D) Survival analysis of WT and Msn KO mice upon tumor injection and adoptive T cell transfer. (E) B6.Rag2–/– mice treated as in A and ACT (i.v.) on day 8 with 2 × 10⁶ Pmel-1 T cells coinfused with CD4+CD25– T cells isolated from WT (CD45.1, black) or Msn KO (CD45.2, red) bone marrow chimeric mice. WT CD45.1 are from WT>WT bone marrow chimeric mice and CD45.2 are from Msn KO>WT chimeric mice reconstituted for 8 weeks. (F) Tumor growth kinetics in mice treated as indicated in E. (G and H) Tumor weight and percentage of tumor-infiltrating Pmel-1 CD8+ T cells at endpoint. (I and J) Endpoint analysis of the tumor-infiltrating lymphocytes (TILs) for FOXP3+ iTregs in the tumor (I) and expression of TβRII on CD4+ TILs (J). (K and L) The spleen of tumor-bearing mice analyzed for FOXP3+ iTregs (K) and TβRII expression on splenic CD4+ T cells (L). n = 5 per group. Data are reported as the mean ± SEM. *P < 0.05, **P = 0.01, ***P = 0.001 by Student’s t test (C and G–L), by Mann-Whitney test (B and F), or by log-rank test (D).

