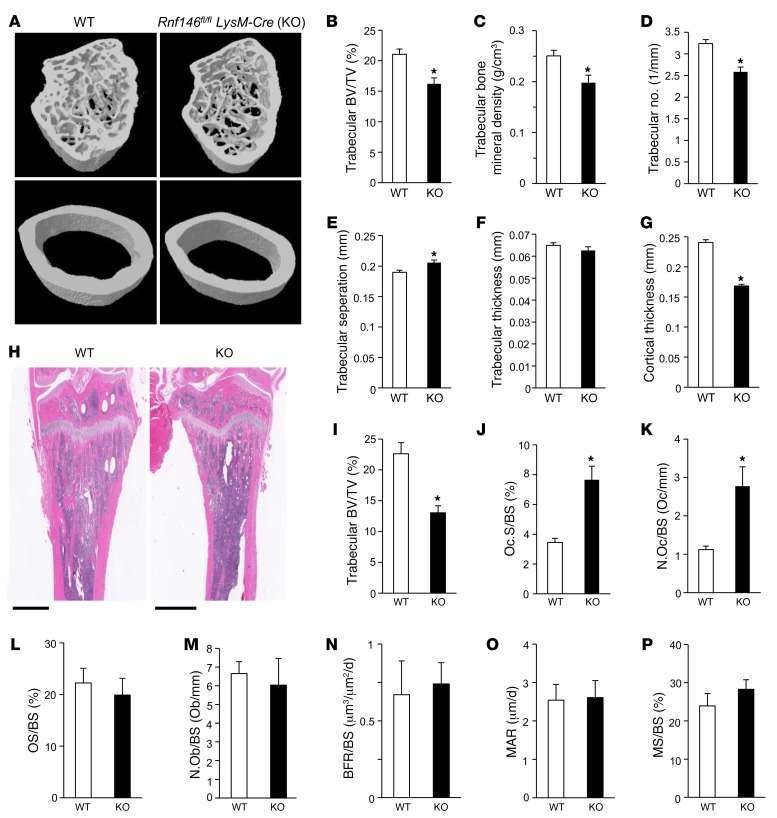
Figure 4. Rnf146fl/fl LysM-Cre mice are osteopenic due to active osteoclastogenesis.
(A) μCT reconstruction of the trabecular region below the distal femur growth plate (top panels) and the cortical region of midshaft femurs (bottom panels) of 12-week-old WT and Rnf146fl/fl LysM-Cre (KO) mice. (B–G) μCT-derived measurements of trabecular bone volume per total volume (BV/TV) (B), trabecular bone mineral density (C), trabecular number (D), trabecular separation (E), trabecular thickness (F), and cortical thickness (G) of 12-week-old WT and Rnf146fl/fl LysM-Cre (KO) mice. n = 6. (H) H&E staining of tibiae from 12-week-old WT and Rnf146fl/fl LysM-Cre (KO) mice. Scale bars: 1 mm. (I–M) Histomorphometric analysis of trabecular bone volume per total volume (I), osteoclast surface per bone surface (Oc.S/BS) (J), osteoclast number per bone surface (N.Oc/BS) (K), osteoid surface per bone surface (OS/BS) (L), and osteoblast number per bone surface (N.Ob/BS) (M) of 12-week-old WT and Rnf146fl/fl LysM-Cre (KO) mice. n = 5–7. (N–P) Dynamic histomorphometric analysis of tibial trabecular bone formation rate (BFR/BS) (N), mineral apposition rate (MAR) (O), and mineralizing surface (MS/BS) (P) of 12-week-old WT and Rnf146fl/fl LysM-Cre (KO) mice. n = 5–6. P values were determined by unpaired t test. Data are presented as mean ± SEM. *P < 0.05.

