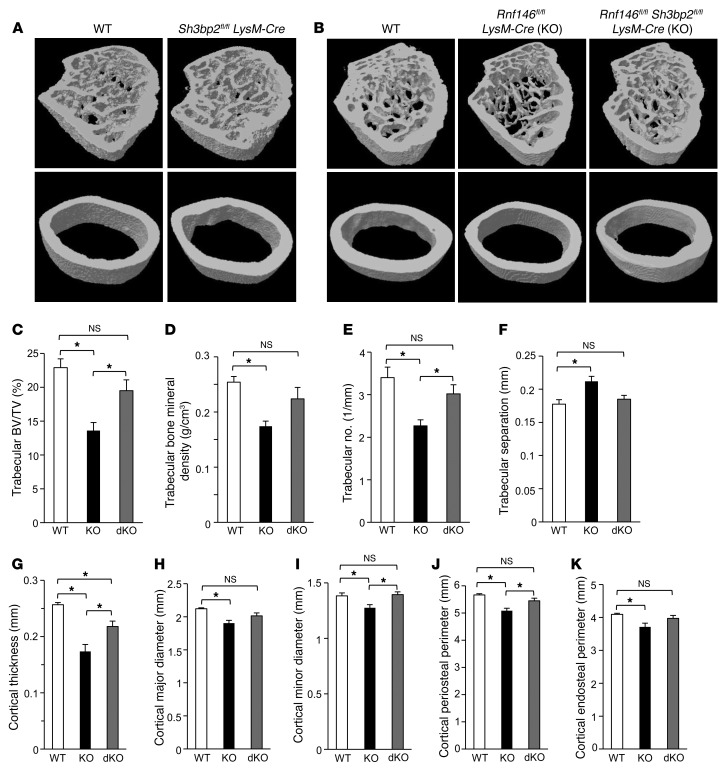
Figure 6. Loss of 3BP2 rescued osteopenia observed in Rnf146fl/fl LysM-Cre mice.
(A) μCT reconstruction of the trabecular region below the distal femur growth plate (top panel) and the cortical region of midshaft femurs (bottom panel) of 12-week-old WT and Sh3bp2fl/fl LysM-Cre mice. (B) μCT reconstruction of the trabecular region below the distal femur growth plate (top panel) and the cortical region of midshaft femurs (bottom panel) of 12-week-old WT, Rnf146fl/fl LysM-Cre (KO), and Rnf146fl/fl Sh3bp2fl/fl LysM-Cre (dKO) mice. (C–K) μCT-derived measurements of trabecular bone volume (C), trabecular bone mineral density (D), trabecular number (E), trabecular separation (F), cortical thickness (G), cortical major diameter (H), cortical minor diameter (I), cortical periosteal perimeter (J) and cortical endosteal perimeter (K) of 12-week-old WT, Rnf146fl/fl LysM-Cre (KO), and Rnf146fl/fl Sh3bp2fl/fl LysM-Cre (dKO) mice. n = 6. P values were determined by ANOVA with Tukey-Kramer’s post hoc test. Data are presented as mean ± SEM. *P < 0.05.

