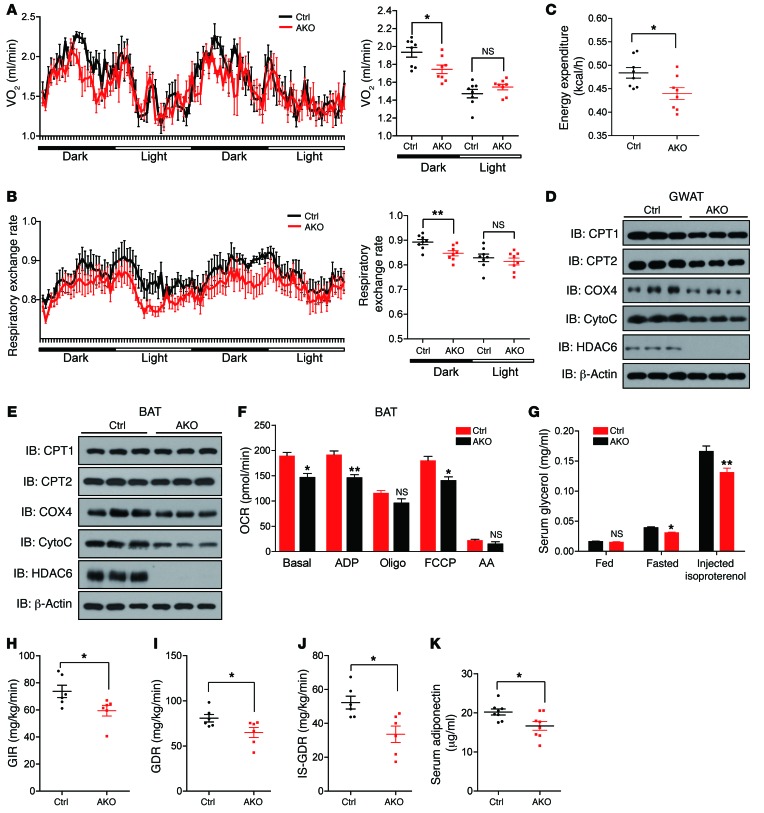
Figure 2. Animals with adipose tissue–specific knockout of Hdac6 have decreased metabolic activity and lower insulin sensitivity.
(A) Oxygen consumption (VO2) of control and Hdac6 AKO mice monitored for 48 hours (n = 8 mice per group). (B) Respiratory exchange rate analysis according to dark and light phases. From 8pm to 8am (next day) refers to dark phases. From 8am to 8pm refers to light phases. (n = 8 mice per group). (C) Energy expenditure analysis of control and Hdac6 AKO mice monitored for 48 hours (n = 8 mice per group). (D) Protein expression of CPT1, CPT2, COX4, and cytochrome c (CytoC), which are important in mitochondrial respiration in the GWAT of control and Hdac6 AKO mice (n = 3 mice per group). (E) Protein expression of CPT1, CPT2, COX4, and cytochrome c, which are important in mitochondrial respiration in the BAT of control and Hdac6 AKO mice (n = 3 mice per group). (F) Quantitative analysis of oxygen consumption rate (OCR) of mitochondria isolated from the BAT of control and Hdac6 AKO mice using Seahorse equipment (n = 3 mice per group). (G) Lipolysis in control and Hdac6 AKO mice under fed, fasted, and isoproterenol-stimulated conditions (n = 6 mice per group). (H) Levels of GIR of control and Hdac6 AKO mice (n = 6 mice per group). (I) Levels of GDR of control and Hdac6 AKO mice (n = 6 mice per group). (J) Rate of insulin-stimulated glucose disposal (IS-GDR) of control and Hdac6 AKO mice (n = 6 mice per group). (K) Reduced serum levels of adiponectin in control and Hdac6 AKO mice (n = 6 mice per group). Data represent mean ± SEM. *P < 0.05, **P < 0.01, by 2-tailed Student’s t test.

