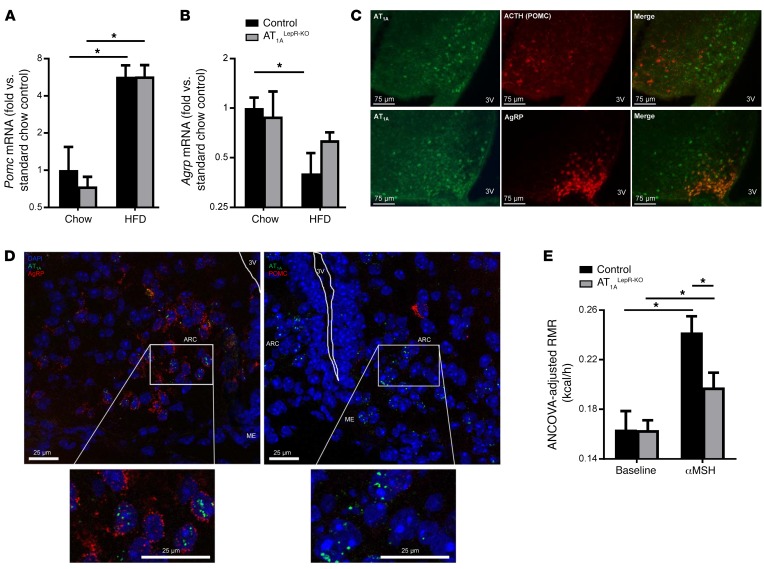
Figure 5. AT1A in AgRP neurons.
(A and B) Hypothalamic Pomc (A) and Agrp (B) mRNA expression in control and AT1ALepR-KO mice on a chow diet or after 5 weeks of a 45% HFD (n = 12 chow-fed control mice; n = 4 HFD-fed control mice; n = 4 chow-fed AT1ALepR-KO mice; n = 6 HFD-fed AT1ALepR-KO mice). (C) Representative photomicrographs of AT1A receptor and ACTH (POMC) or AgRP in the ARC of chow-fed Lepr-Cre ROSA-stopflox-tdTomato NZ44 animals (scale bars: 75 μm). (D) FISH for AT1a, Pomc, and Agrp mRNA transcripts in the ARC of WT C57BL/6J mice (scale bars: 25 μm). (E) ANCOVA-adjusted RMR at baseline and in response to i.p. administration of [Nle4D–Phe7]-αMSH (4.5 μg/g) in control and AT1ALepR-KO mice (n = 3 control baseline; n = 3 control αMSH-treated mice; n = 7 chow-fed AT1ALepR-KO mice; n = 7 αMSH-treated AT1ALepR-KO mice). *P < 0.05, by Tukey’s multiple comparisons procedure.

