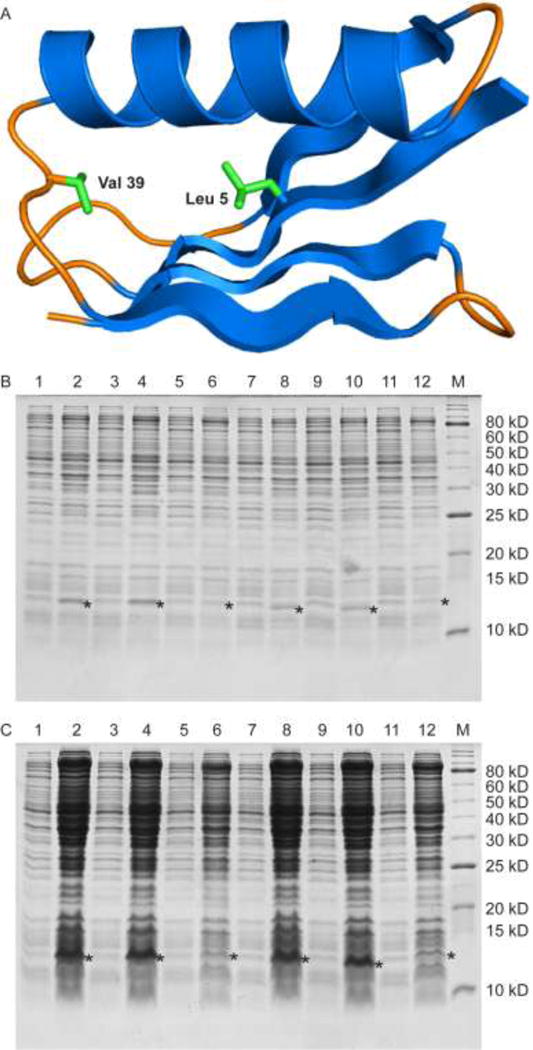
Figure 12.

Expression levels of GB1 Val39Met and GB1 Leu5Met. (A) Ribbon diagram of GB1 (PDB ID: 2QMT).[37] In green are the side chains of the residues mutated to Met in the two variants. Val 39 is located on an internal loop between the α-helix and a β-strand while Leu 5 is located on a β-strand and is packed against the hydrophobic core of the protein. (B) Expression levels of GB1 Val39Met and GB1 Leu5Met assessed by a reducing 16% Tris-glycine gel. Lanes 1, 3, 5 are samples of GB1 Val39Met taken before induction, and lanes 2, 4, 6 are samples of GB1 Val39Met taken after induction with 200 μM Met, 200 μM SeM + 22 μM Met, and 200 μM TFSeM (as 7b) + 22 μM Met, respectively. Lanes 7, 9, 11 are samples of GB1 Leu5Met taken before induction, and lanes 8, 10, 12 are samples of GB1 Leu5Met taken after induction with 200 μM Met, 200 μM SeM + 22 μM Met, and 200 μM TFSeM + 22 μM Met, respectively. Induced and uninduced samples were adjusted to have the same optical density to aid the comparison of expression levels. M denotes molecular weight markers. The star denotes the location of expressed GB1 variants. The molecular weight of GB1 Val39Met with the hexahistidine tag is 8823 Da and of GB1 Leu5Met is 8809 Da. Both run with an apparent molecular weight of 12 kDa due to dimerization. (C) Same as in B but the samples’ optical density was not adjusted to the same value.
