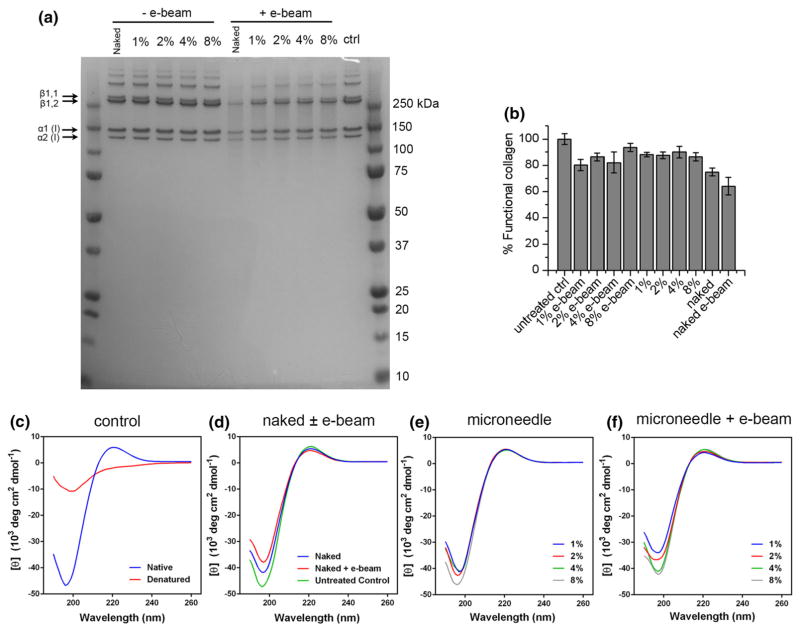
FIGURE 4.
(a) SDS PAGE showing naked C1 and C1 recovered from PVP-C1 microneedles patch made with 1, 2, 4, 8% C1 (w/w) with and without e-beam treatment. Control is untreated collagen in 50 mM MES buffer (pH 6.0). (b) Concentrations of functional collagen were determined by rat type I collagen specific ELISA. Results are presented as % functional collagen compared to untreated controls (mean ± SD, n = 3). (c) CD spectra of C1 as controls, native conformation at 4 °C and denatured at 60 °C. (d) CD spectra of untreated control, air dried naked C1 with and without e-beam treatment. (e) CD spectra of C1 recovered from 1, 2, 4, 8% microneedles after preparation without e-beam treatment. (f) CD spectra of C1 recovered from 1, 2, 4, 8% microneedles that were subjected to e-beam sterilization.

