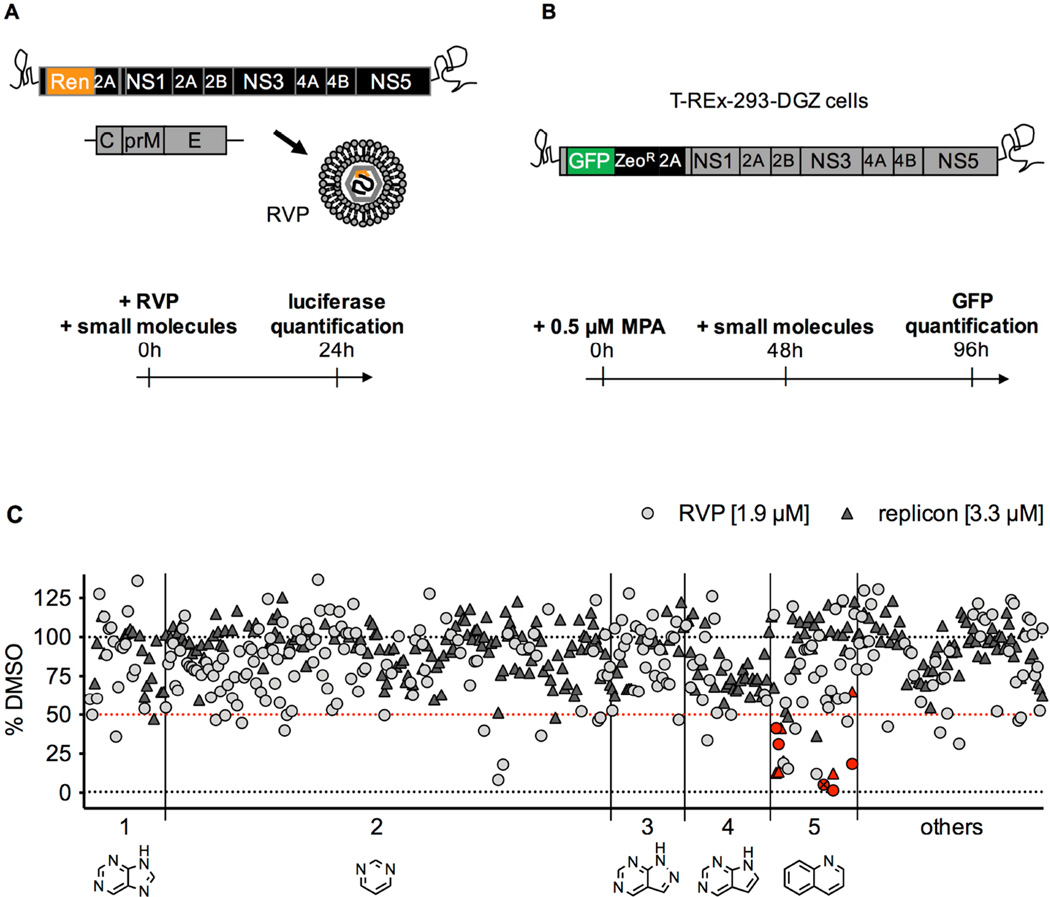
Figure 1. Description of the screens that led to the identification of covalent inhibitors of DV2.
A. In the reporter viral particles (RVP) screen, Huh7 cells were treated with a subset of 250 compounds (final concentration 1.9 µM), then infected with DV2 RVP. Renilla luciferase signal encoded by the WNV replicon was measured in cells at 24 hours post-infection.
B. In the replicon screen, T-REx-293-DGZ cells were pre-treated for 48 hours with 0.5 µM mycophenolic acid (MPA), then treated with a subset of 288 compounds (final concentration 3.3 µM) for 48 hours after which GFP signal encoded by the DV2 replicon was measured.
C. Data for both screens (light grey circles for RVP; dark grey triangles for replicon) are plotted as a percentage of the DMSO-treated cells with background values set as the signal from mock-infected cells for the RVP screen and signal from cells treated with 10 µM MPA for the replicon screen. Molecules causing an inhibition of signal > 50% were identified as “hits” (the 50% selection cut-off is represented as a red dotted line). The compounds are distributed into 5 groups along the x axis based on their core structure (shown below the axis): 1 – purine; 2 – pyrimidine; 3 – pyrazolopyrimidine; 4 – pyrrolopyrimidine; 5 – quinoline. The remaining 56 compounds include various structures and are grouped under “others”. The quinoline compounds further studied in the present work are identified by red symbols. QL-XII-47 is identified by a crossed-out symbol.

