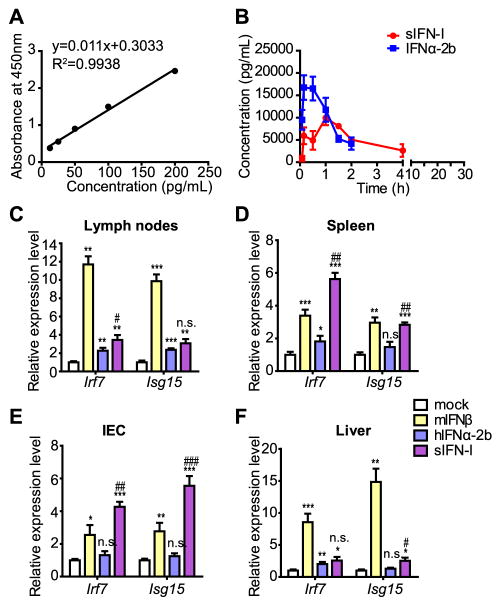
Figure 4. sIFN-I displays different pharmacokinetics and distinct tissues responsiveness in vivo.
A. Calibration curve of human IFNα ELISA used for pharmacokinetics assay.
B. C57BL/6 wild type mice were subjected to intraperitoneal injection in each group (n=3) with hIFNα-2b or sIFN-I. Serum was obtained at the indicated time point and the concentrations of serum IFNs were detected by ELISA assay. Comparison of the pharmacokinetic curves of hIFNα-2b or sIFN-I administered as in Panel A. Additional information is provided in the Supplementary Table 3.
C. C57BL/6 wild type mice were intraperitoneal injected with murine IFNβ (1 μg/mL), human IFNα-2b (1 μg/mL) or sIFN-I (1 μg/mL), respectively. Primary tissues were collected for gene expression detection after 6-h treatment. The induction of Irf7 and Isg15 mRNA in lymph nodes was quantified by qPCR.
D. Analysis of Irf7 and Isg15 mRNA was quantified by qPCR in spleen tissues of mice described in Panel C.
E. Analysis of Irf7 and Isg15 mRNA was quantified by qPCR in intestinal epithelial tissues of mice described in Panel C.
F. Analysis of Irf7 and Isg15 mRNA was quantified by qPCR in liver tissues of mice described in Panel C. *, P<0.05, **, P<0.01, ***, P<0.001, vs mock group; #, P<0.05, ##, P<0.01, ###, P<0.001, vs IFNα-2b group.

