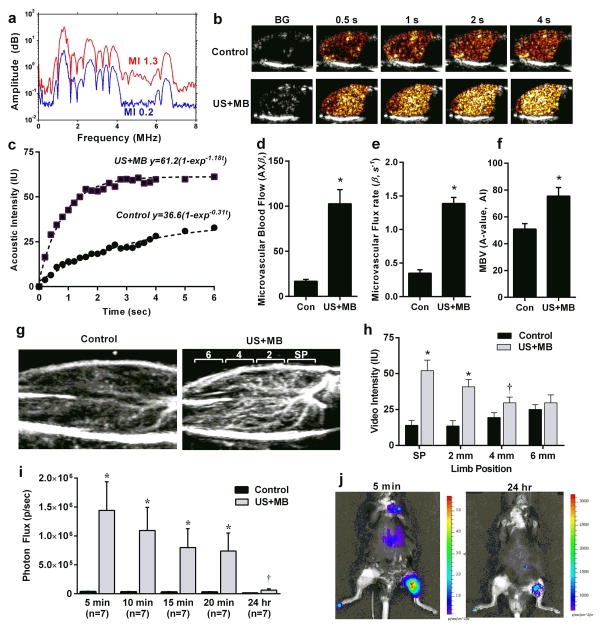
Figure 1. Release of ATP by US Cavitation.
(a) Passive cavitation detection obtained from the mouse hindlimb during US (1.3 MHz) exposure of intravenously-infused MBs. Inertial cavitation is indicated by the broad-band signal between the harmonic peaks seen at a mechanical index of 1.3 but not at 0.2. (b) Examples of frames obtained during low-power CEU perfusion imaging from the proximal hindlimb adductor muscles and (c) corresponding time-intensity data obtained from a control (non-US-exposed) and an US-exposed limb illustrating greater blood flow in the latter (BG = background). Data were obtained 10 min after exposure to high-power US for 10 min during intravenous MB infusion. (d) Microvascular blood flow and (e) microvascular flux rate, and (f) microvascular blood volume (MBV) (mean ±SEM) in the contralateral control (Con) and US-exposed (US+MB) hindlimbs of mice obtained 10 min after therapeutic US; *p<0.01. (g and h) Examples of CEU of the proximal hindlimb with maximal intensity projection in the long-axis, and mean (±SEM) intensity from the control and US-exposed (US+MB) limbs. Imaging was performed with a 90-degree rotation from therapeutic US plane 10 min after therapeutic US and illustrates distribution of perfusion within the 2 mm-wide therapeutic US sector plane (SP) and distal adjacent sectors at 2, 4, and 6 mm increments. *p<0.01 vs control limb; †p=0.05 versus control. (i) In vivo optical imaging of intravascular ATP release by luciferin-luciferase activity in contr and US-exposed (US+MB) limbs. Data were obtained at various intervals after completing a 10 min US exposure during MB infusion. *p<0.001 vs control; †p<0.05 versus control. (j) Examples of optical imaging illustrating focal ATP production at the site of US cavitation (left proximal hindlimb).

