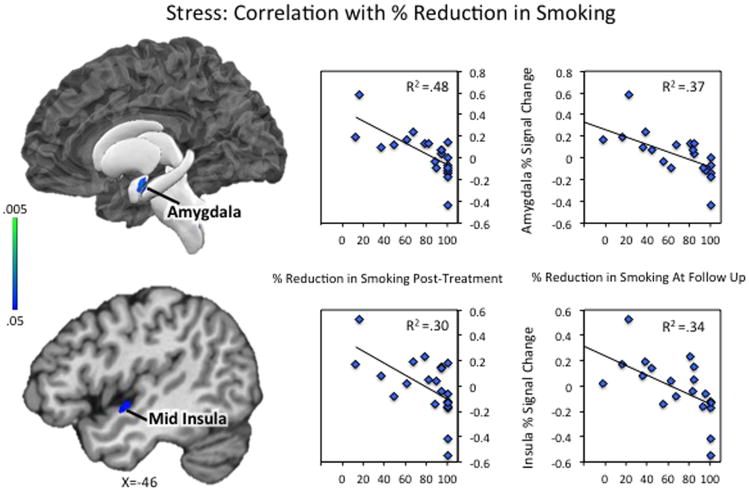
Figure 3. Stress Reactivity: Correlations with % Reduction in Smoking.
Neural activity during stressful scenarios was correlated with % reduction in cigarettes per day from pre- to post-treatment (left scatter plots) and % reduction in cigarettes per day from pre-treatment to 3-month follow-up (right scatter plots). Full correlation results are displayed in Supplementary Figures S1–S4. A formal conjunction analysis between the two correlation maps revealed a set of regions that were responsive to stressful scenarios, and correlated with CPD reduction at both timepoints. Those included the left amygdala, extending into the anterior/mid insula (as shown here) and parahippocampal gyrus, as well as right hippocampus, parahippocampal gyrus, and posterior insula (shown in Supplementary Figure S7-S8). Scatter plots represent the extracted cluster-averaged percent signal change during stress scenarios in regions identified in the conjunction analysis.

