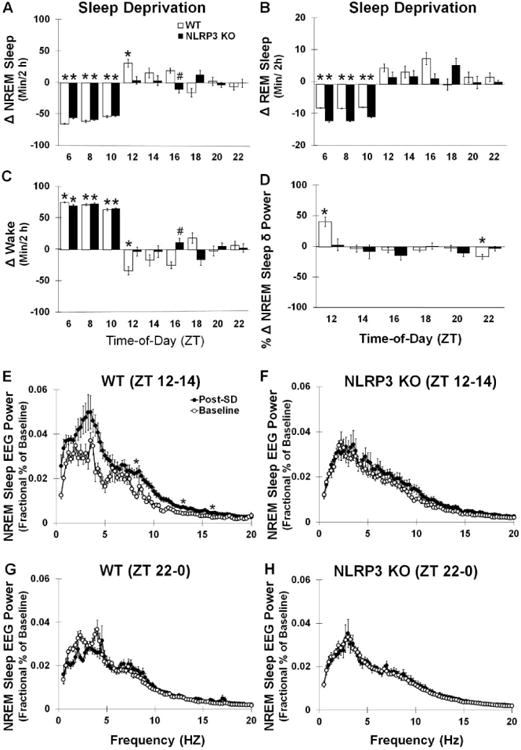
Fig 4.

Sleep during SD and recovery sleep responses to SD. Both WT and NLRP3 mice exhibited significant reductions in (A) NREM and (B) REM sleep durations and enhanced (C) waking during the 6 hours of SD occurring prior to dark onset (ZT 6-12). WT mice but not NLRP3 KO mice had significantly enhanced recovery sleep after SD during NREM and REM sleep states. WT mice also exhibited significantly enhanced NREM sleep δ power during the first 2 hours post-SD (ZT 12-14) (D, E). WT and NLRP3 KO mice both exhibited significant enhancements in NREM sleep EEG power spectra (0.5-20 Hz frequency range) post-SD compared to baseline values, although post-hoc analysis only indicated that WT mice had enhancements in the 8.25, 13, and 16 Hz frequency bands. Significant reductions in NREM sleep δ power and NREM sleep EEG power spectra (0.5-20 Hz frequency range) 10-12 h post-SD (ZT 22-0)(i.e., negative rebound) (G) were found in WT mice, which was not found in NLRP3 KO mice (D, F, H). N = 8 per genotype. Bars and (*) indicate significant difference between baseline and treatment. (#) indicates significant difference between genotypes. The Bonferroni corrected α value was set at p < 0.03 for sleep states during sleep deprivation, p < 0.008 for sleep states during recovery sleep, and p < 0.0006 for EEG power frequency bands.
