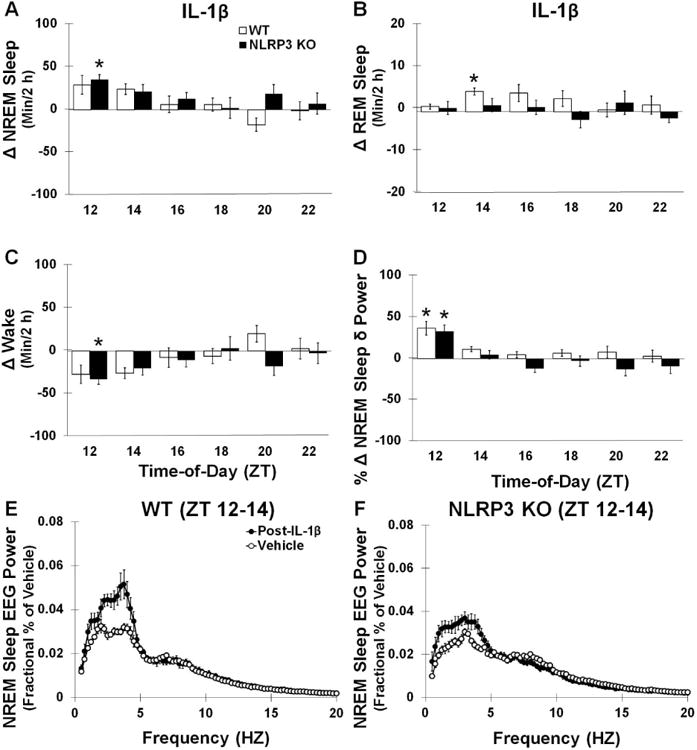
Fig 7.

Post-IL-1β infusion sleep responses. Both WT and NLRP3 mice showed significantly enhanced NREM sleep post- IL-1β compared to the vehicle (A). However, WT mice exhibited significantly enhanced REM sleep responses 4-6 h post-infusion (ZT 14-16) which was not found in NLRP3 KO mice (B). NLRP3 KO mice exhibited significant enhancements in wakefulness during the first 2 h post-IL-1β (C). Enhancements in NREM sleep δ power spectra were also found in the first 2 h post-infusion in both WT and NLRP3 KO mice (D, E, F). (*) indicates significant difference between baseline and treatment. However, post-hoc analysis did not show significant differences at individual frequency bands. N = 7 per genotype. (#) indicates significant difference between genotypes. The Bonferroni corrected α value was set at p < 0.03 for sleep states during recovery sleep and p < 0.0006 for EEG power frequency bands.
