
Figure 1. Physiological Data for Experiment 1.
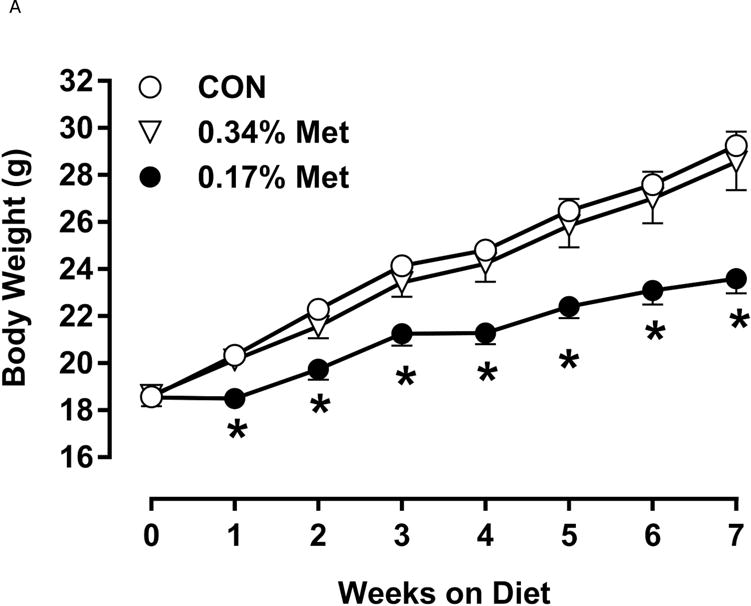
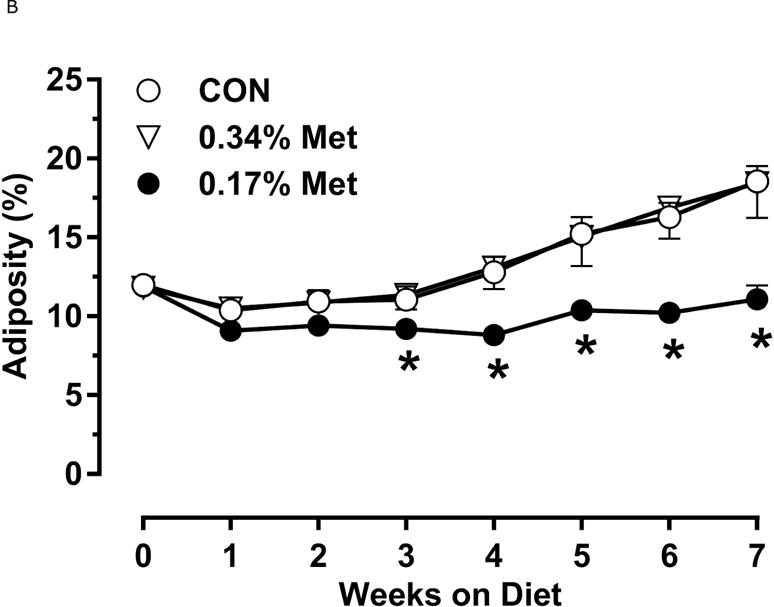
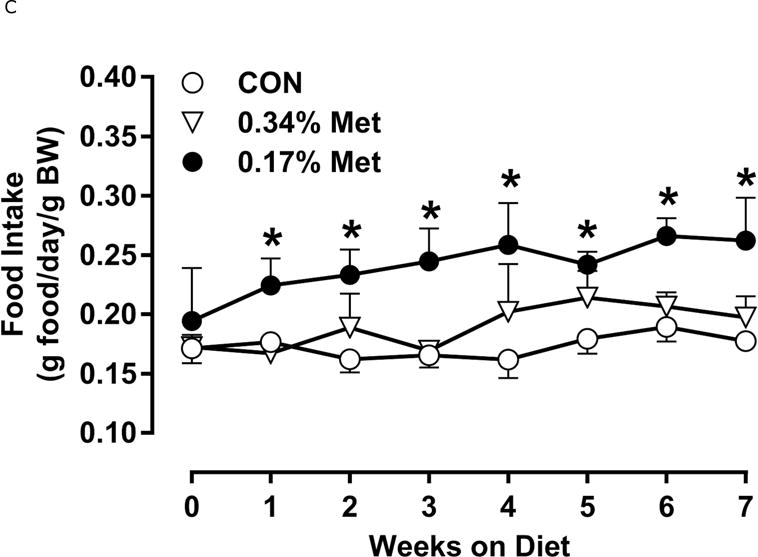
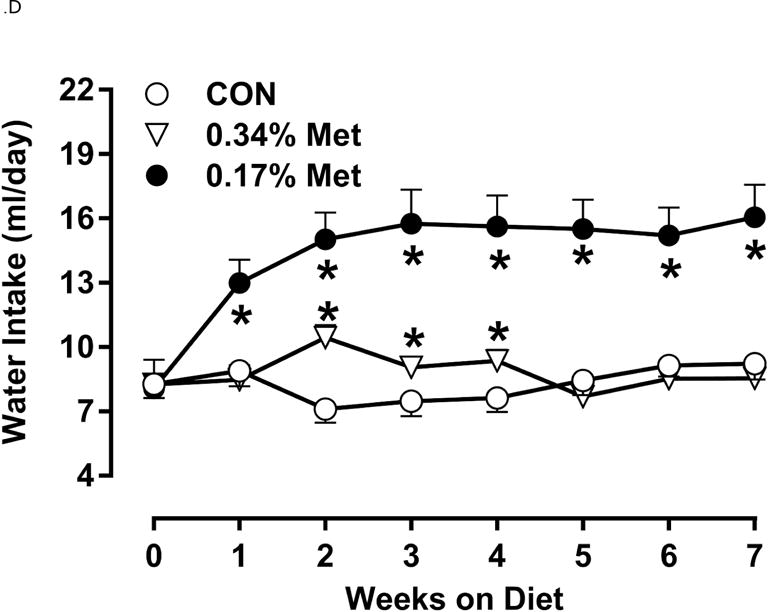
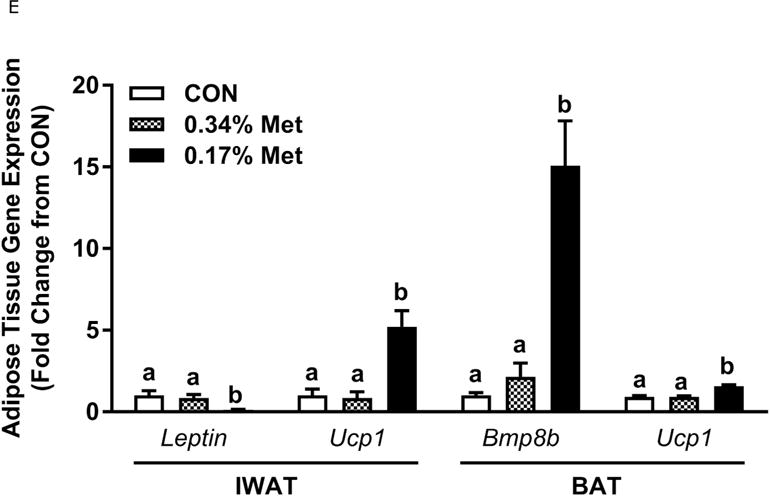
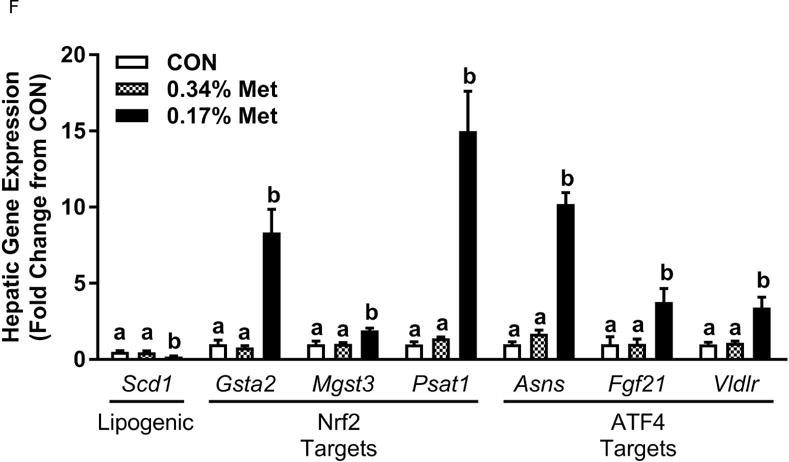
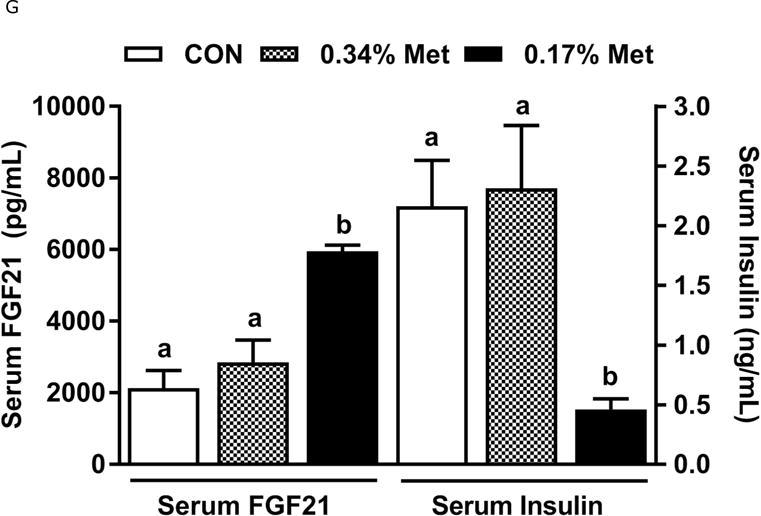
Body weight (A), food (B) and water (C) intake, and adiposity (D) were measured at weekly intervals over the course of the entire study. Adipose tissue (E) and hepatic (F) gene expression were measured via qPCR and expressed as the fold change between MR and CON. Serum metabolites FGF21 and insulin (G) were measured via ELISA, while serum and hepatic triglyceride content (H) were analyzed via colorimetric assays. CON – control; MR – Met restricted diets; IWAT – inguinal white adipose tissue; BAT – brown adipose tissue; Scd1 – stearoyl CoA desaturase 1; Nrf2 – Nuclear factor erythroid 2-related factor 2; Gsta2 – Glutathione S-Transferase α2; Mgst3 – Microsomal Glutathione S-Transferase 3; Psat1 – Phosphoserine Aminotransferase 1; ATF4 – Activating Transcription Factor 4; Asns – asparagine synthase; Vldlr – very low density lipoprotein receptor; Fgf21 – fibroblast growth factor 21; Ucp1 – uncoupling protein 1; Bmp8b–bone morphogenetic protein 8b. All values are expressed as mean ± SEM. * indicates significant difference from CON at p < 0.05; groups not sharing a common letter are significantly different at p < 0.05.