Figure 4. Evaluation of Energy Expenditure.
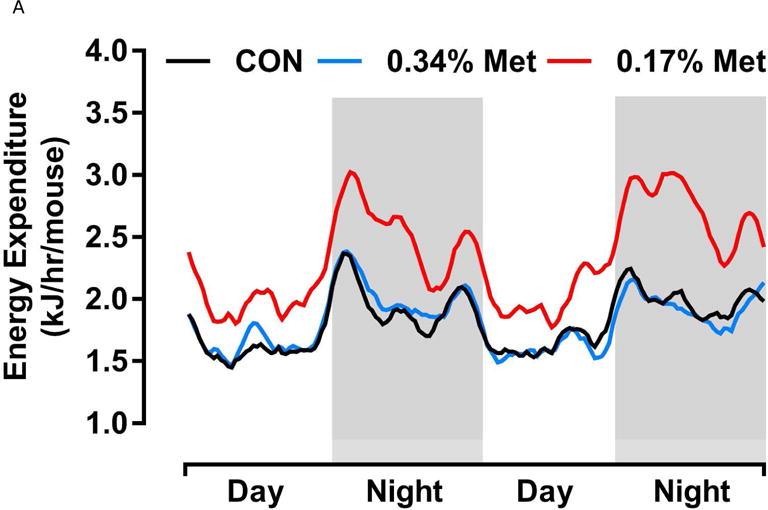
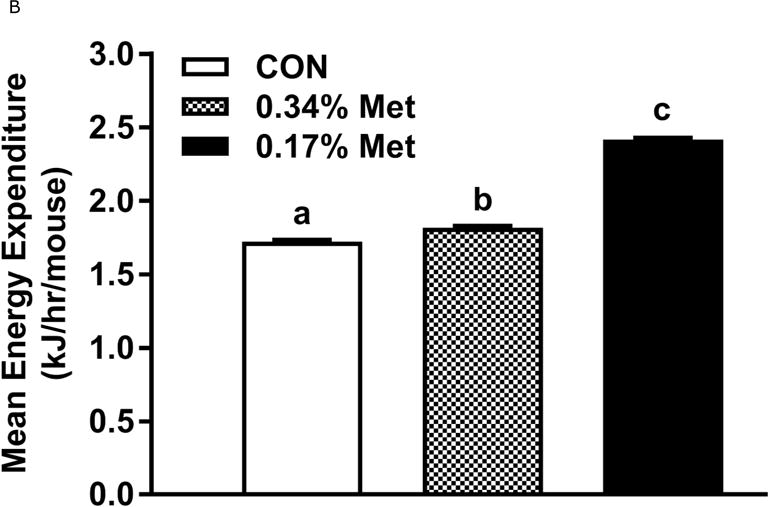
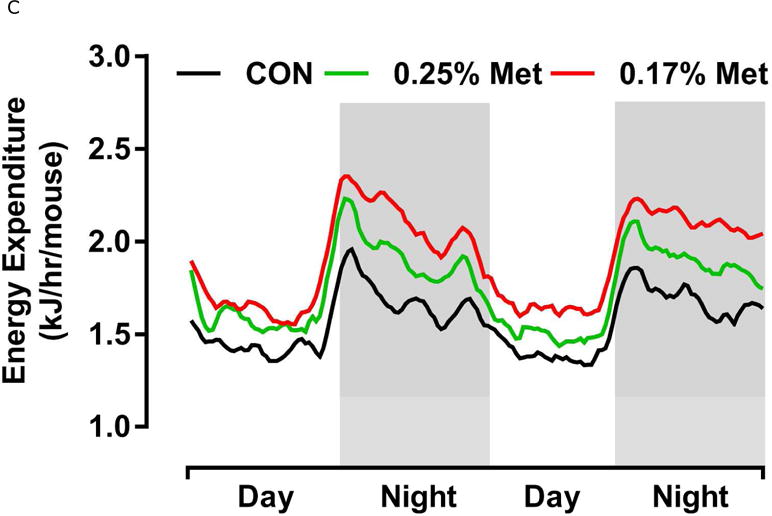
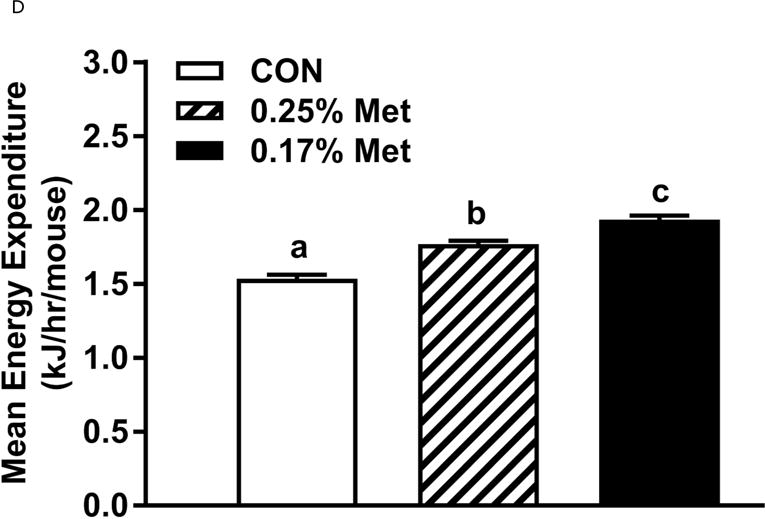
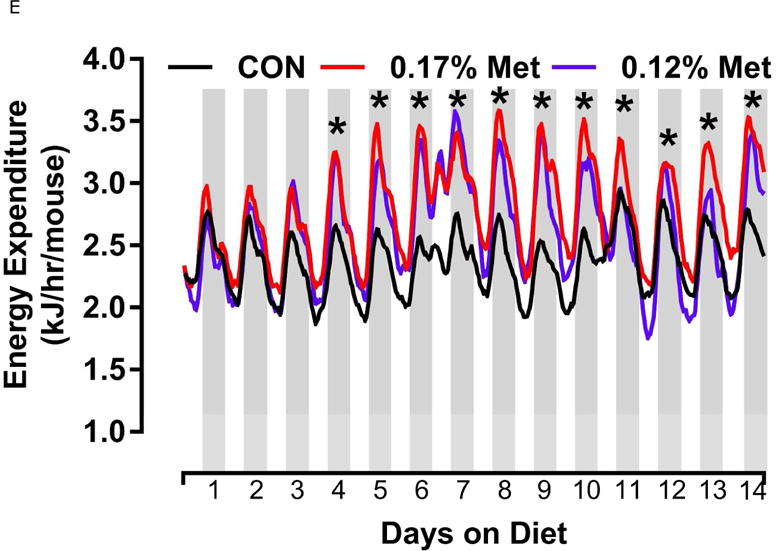
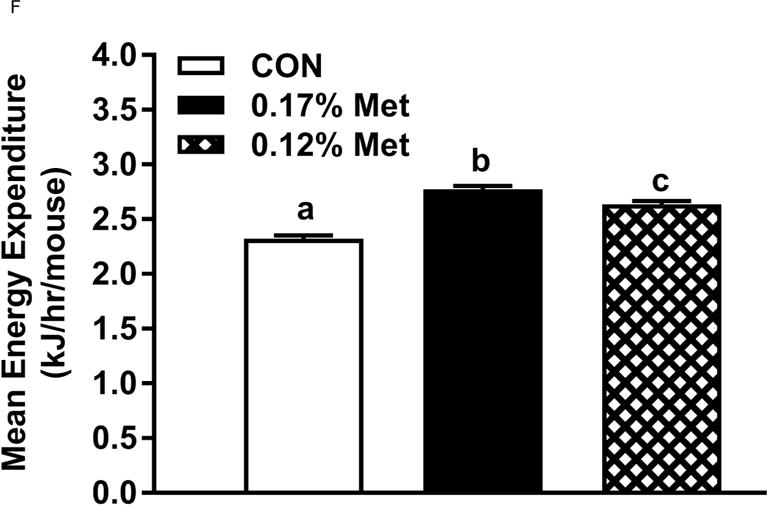
Energy expenditure (EE) was analyzed via indirect calorimetry (IDC). In experiments 1 (A, B) and 2 (C, D), animals were placed in indirect calorimeter chambers for 2 days after consuming either the CON or Met-restricted diets for 8 weeks. In experiment 3 (E, F), 24 mice were equilibrated in the indirect calorimetry chambers for 1 week while consuming the CON diet. On day 0, 8 mice were kept on the CON diet, 8 mice were assigned to the 0.17% Met group, and 8 mice were assigned to the 0.12% Met group. EE was measured in each animal for the following 14 days. Panel 3E shows the average EE of the mice in each group for the first two weeks of the study. EE was measured for 3 days in the 3 groups after 8 weeks on the respective diets and 3F shows the average EE for the 3 dietary groups. Means not sharing a common letter differ at p < 0.05.
