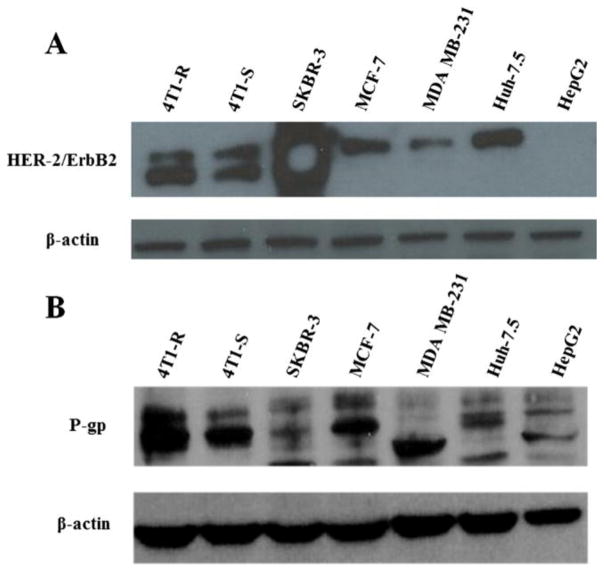
Figure 6.
Measurement of the expression of Her-2 (A.) and P-gp (B.) in different mouse (i.e. 4T1-R and 4T1-S) and human breast cancer cells (i.e. SKBR-3, MCF-7 and MDA MB-231) and human liver cancer cells (i.e. Huh-7.5 and HepG2) by Western blot analysis. The cells were cultured for 24h and then they were scraped by using trypsin-EDTA, washed with PBS, pelleted and then equal amount of proteins was loaded to measure the expression of Her-2 (1:1000 dilution) and P-gp (1:1000 dilution) with β-actin (1:20,000 dilution) running as the loading control.

